Earlier this week I highlighted $48.80-49.20 as a key resistance level for WTI (WTI Crude – New Trading Range Being Established?) with it having been so the last two times it traded at this level.
Despite it finding resistance again on Tuesday and Wednesday, it finally broke above here yesterday and has continued to push on today.
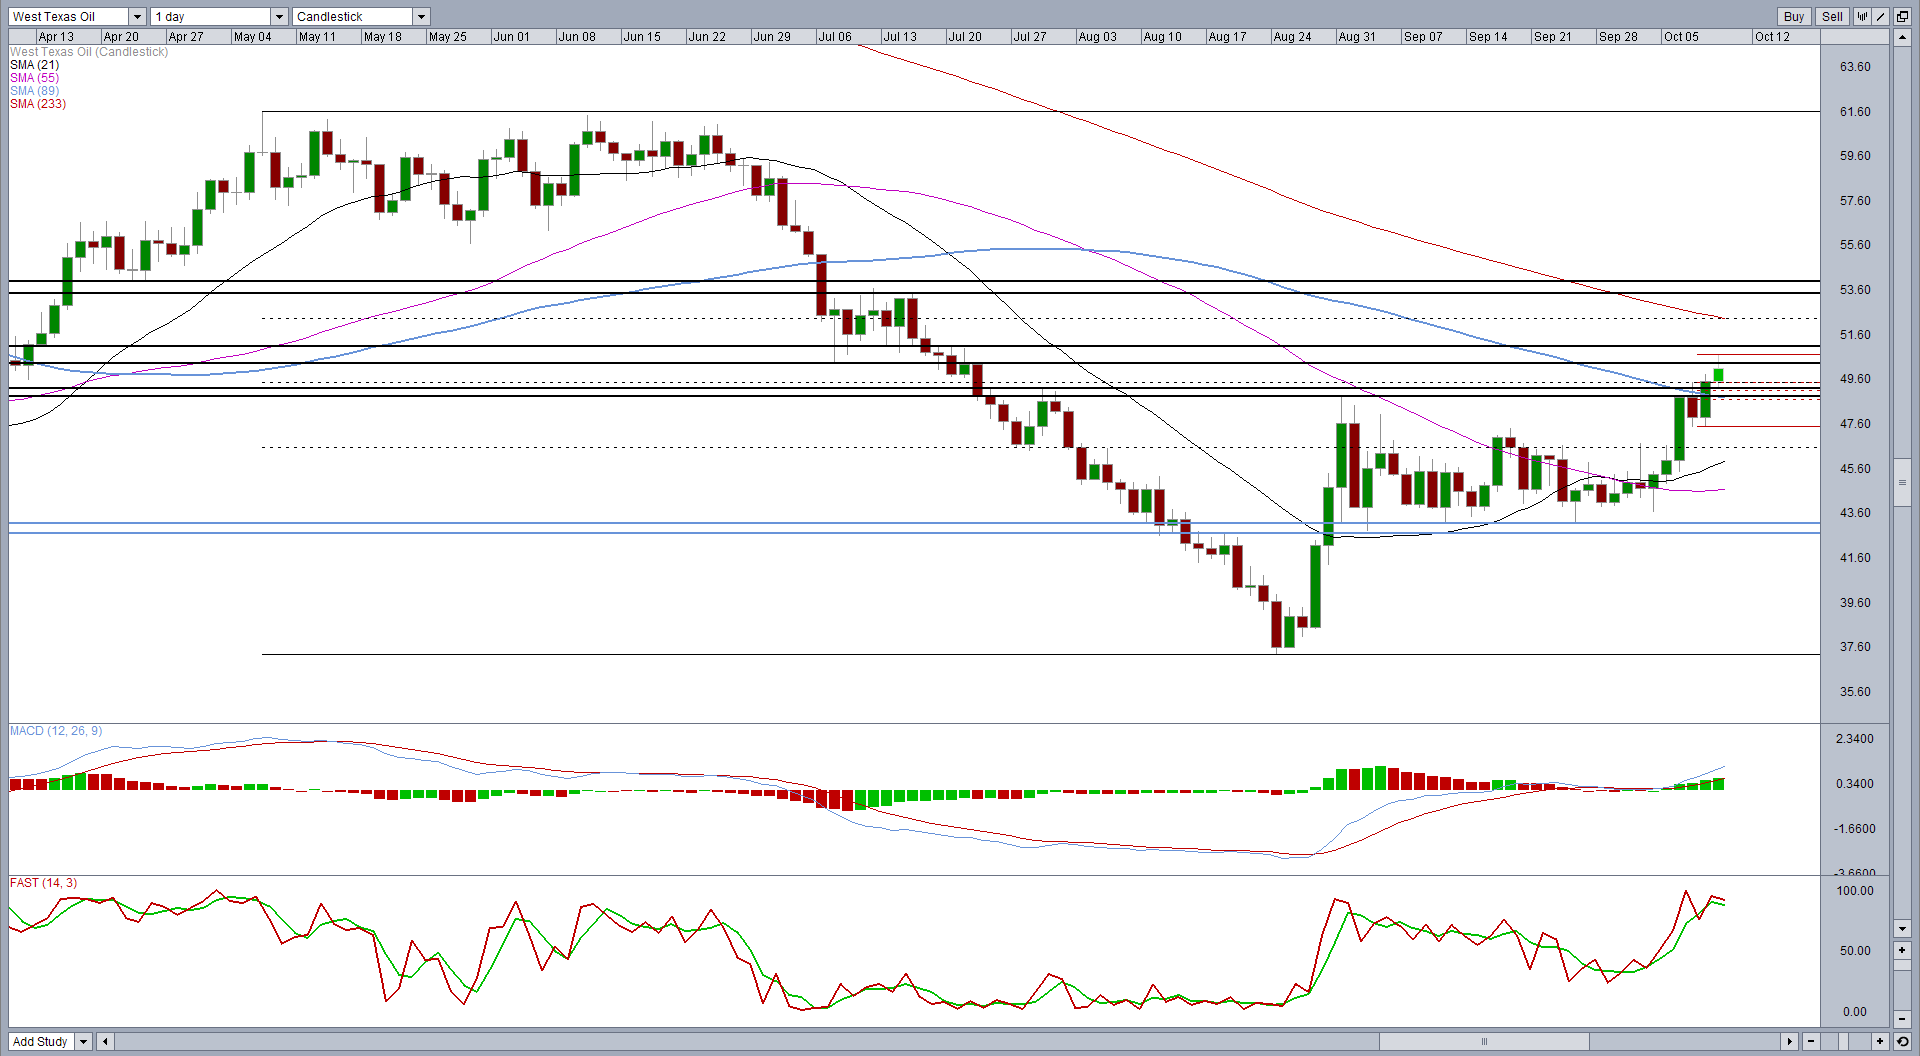
It now appears to have run into resistance again around the next resistance area between $50.25 and $51, which has recently been an interesting area of support and resistance.
As you can see on the hourly chart below, the most recent rallies have come on declining momentum, creating a divergence between price and the stochastic and MACD. This suggests we may see a correction following what has been quite a strong rally to this point.
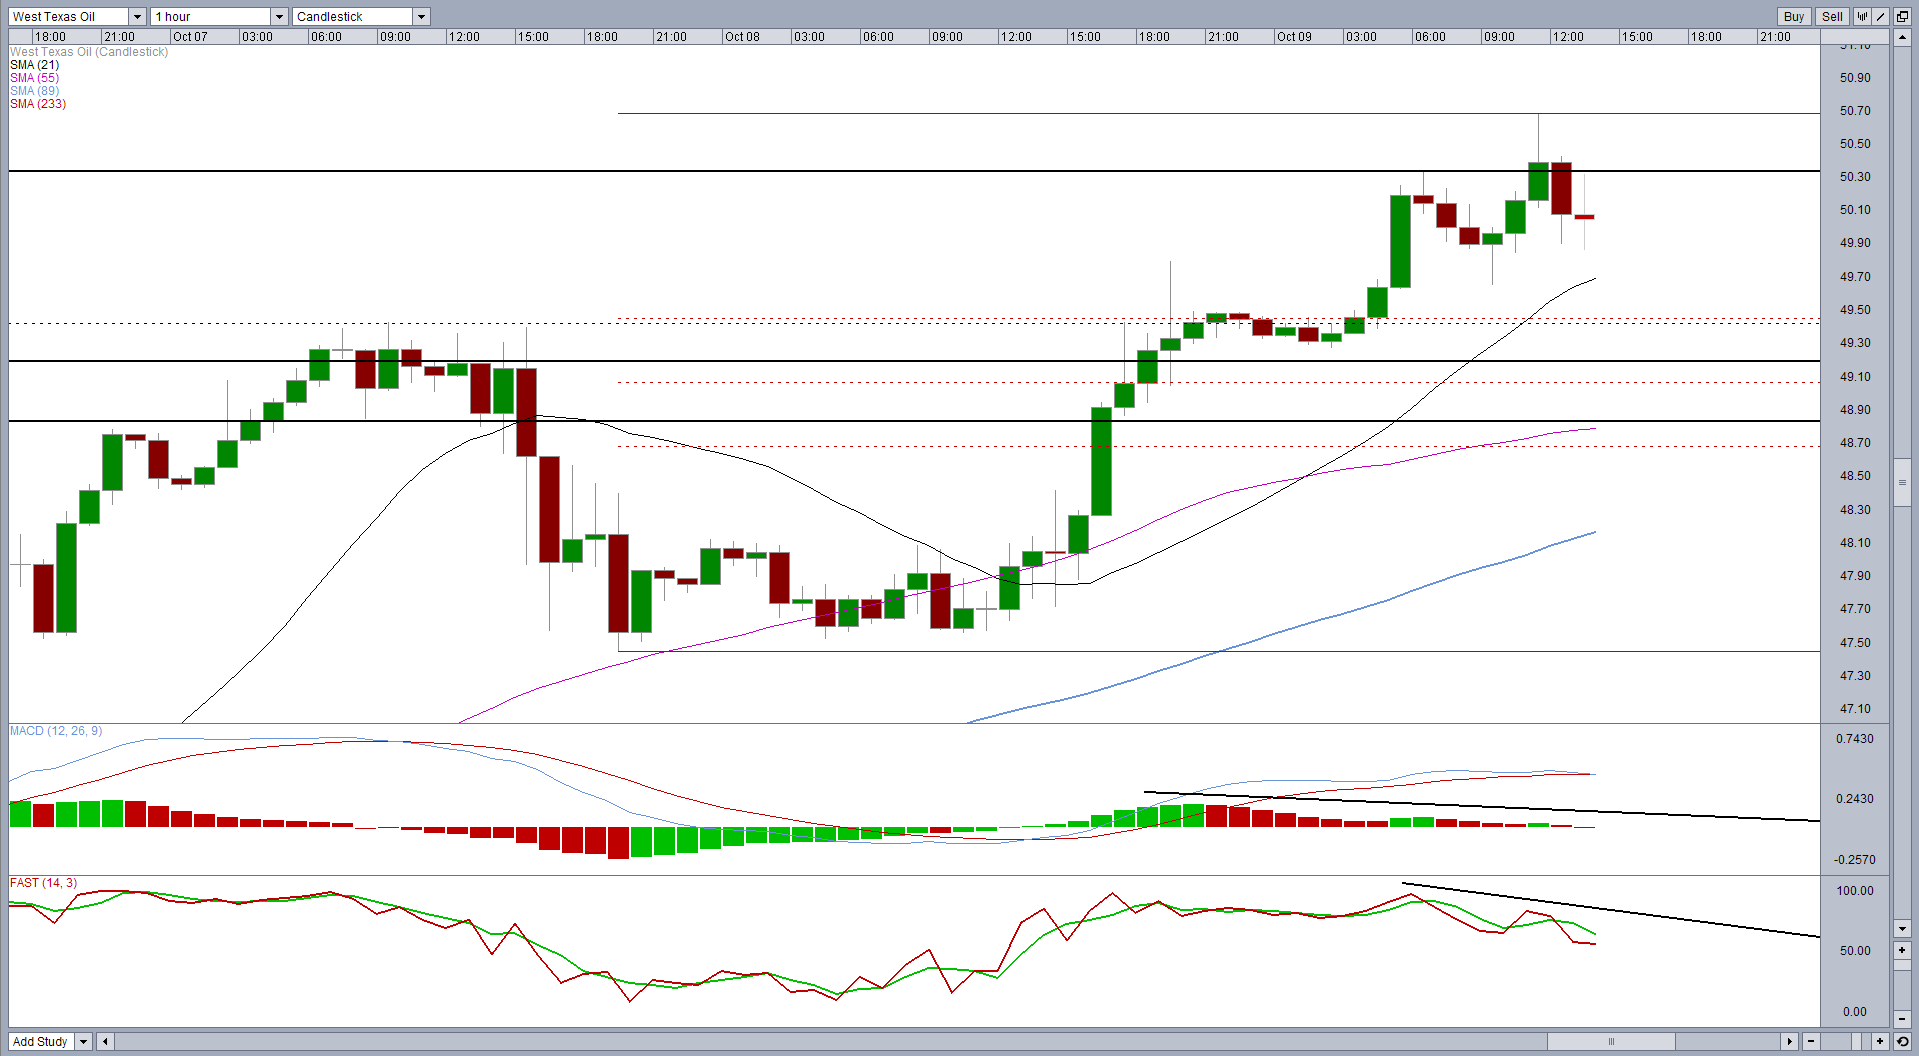
As I suggested previously though, given the hurdle that it overcame this week, I do think this will be a temporary resistance level and more gains could come following a shallow correction. It will be interesting to see now whether that prior resistance level now offers support.
This level coincides with the 50 fib – 6 May highs to 24 August lows – that has previously been resistance, as well as the 38.2 fib – 7 October lows to today’s highs. If this doesn’t hold, the 50 and 61.8 fibs will be of interest, $49.05 and $48.65, respectively.
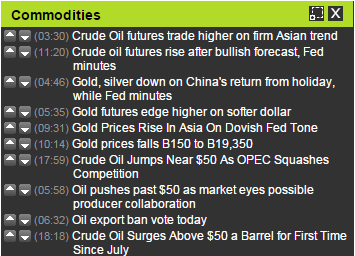
To keep up to date with news affecting oil prices, check out the OANDA News Aggregator and our economic calendar.
Content is for general information purposes only. It is not investment advice or a solution to buy or sell securities. Opinions are the authors; not necessarily that of OANDA Business Information & Services, Inc. or any of its affiliates, subsidiaries, officers or directors. If you would like to reproduce or redistribute any of the content found on MarketPulse, an award winning forex, commodities and global indices analysis and news site service produced by OANDA Business Information & Services, Inc., please access the RSS feed or contact us at info@marketpulse.com. Visit https://www.marketpulse.com/ to find out more about the beat of the global markets. © 2023 OANDA Business Information & Services Inc.

Former Craig
Latest posts by Former Craig (see all)
- Market Insights Podcast – US GDP, RBNZ holds, bitcoin soars - 28 February 2024
- Market Insights Podcast – Nvidia earnings, record highs for stocks - 23 February 2024
- EUR/USD – A bullish breakout or just further consolidation? - 22 February 2024