WTI saw some strength towards the end of last week and the opening day of this on the back of a larger than expected drop in inventories and an apparent hint from OPEC that it may be willing to consider production cuts.
That has been offset over the last couple of days by figures showing record output from Saudi Arabia and today, a larger than expected build in crude oil stocks.
We saw a big correction in WTI between Thursday and Monday – rallied more than 30% off Wednesday’s lows – but this is healthy in the markets and bears may well now see this as having created fresh opportunities.
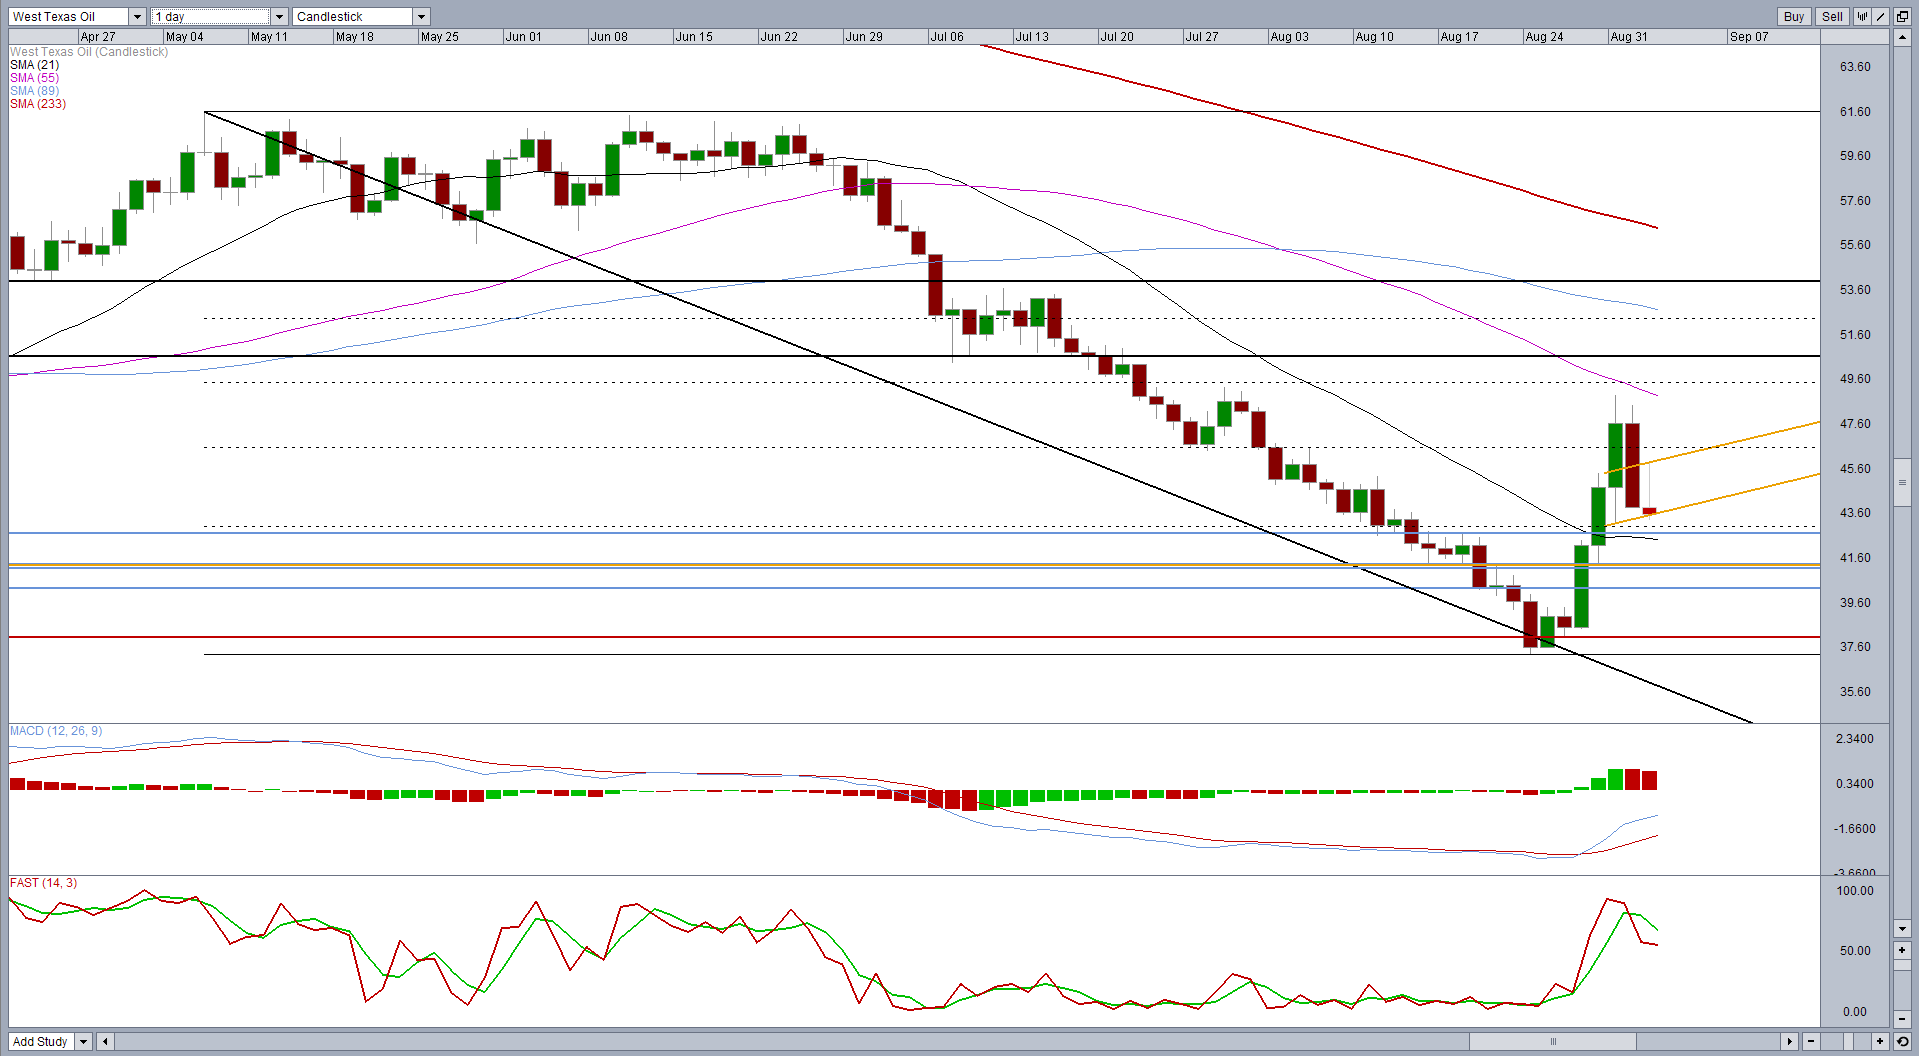
Yesterday’s sell-off created a very bearish looking setup on the daily chart after falling just short of the 50 fib level – 6 May highs to 24 August lows – which suggests traders are treating that brief rally as a retracement, rather than becoming more bullish.
This could be tested today as price action in the last 48 hours has created a head and shoulders formation which could potentially be very bearish if the neckline is broken.
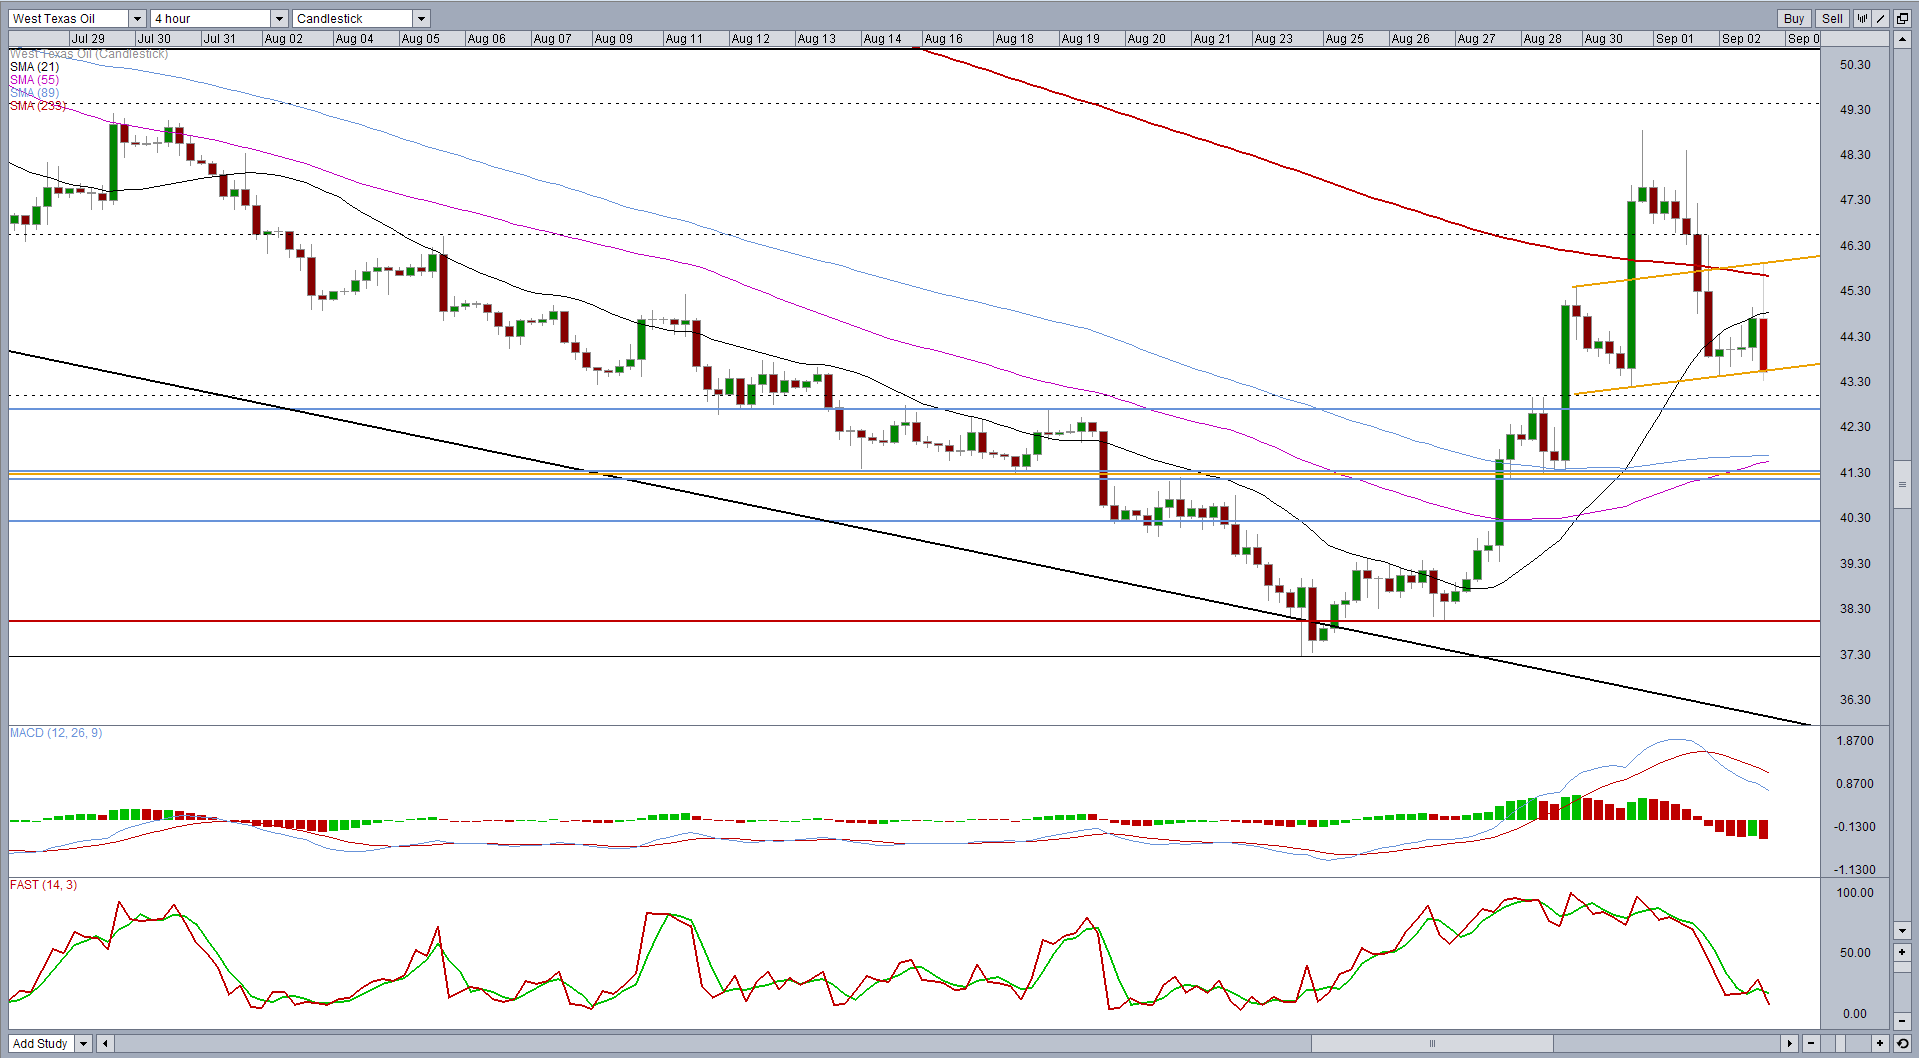
One of the benefits of head and shoulders patterns is they offer possible price projections, a conservative one based on the size of the move from the shoulder to the neckline and a more aggressive one based on the size of the move from the head to the neckline.
The conservative projection (orange line) would be around $41.25 which coincides with a prior region of support and resistance. The more aggressive projection (red line) would be around $38 which coincides with 26 August lows and falls just above this year’s low.
Content is for general information purposes only. It is not investment advice or a solution to buy or sell securities. Opinions are the authors; not necessarily that of OANDA Business Information & Services, Inc. or any of its affiliates, subsidiaries, officers or directors. If you would like to reproduce or redistribute any of the content found on MarketPulse, an award winning forex, commodities and global indices analysis and news site service produced by OANDA Business Information & Services, Inc., please access the RSS feed or contact us at info@marketpulse.com. Visit https://www.marketpulse.com/ to find out more about the beat of the global markets. © 2023 OANDA Business Information & Services Inc.

Former Craig
Latest posts by Former Craig (see all)
- Market Insights Podcast – US GDP, RBNZ holds, bitcoin soars - 28 February 2024
- Market Insights Podcast – Nvidia earnings, record highs for stocks - 23 February 2024
- EUR/USD – A bullish breakout or just further consolidation? - 22 February 2024