The long-term decline in Gold has been blamed on a number of factors; stronger dollar, prospect of Federal Reserve hiking interest rates and low inflation to name a few.
Over the last couple of weeks, the weakness in the dollar on the back of expectations that the Fed may be forced to delay the first rate hike has aided the rally in Gold.
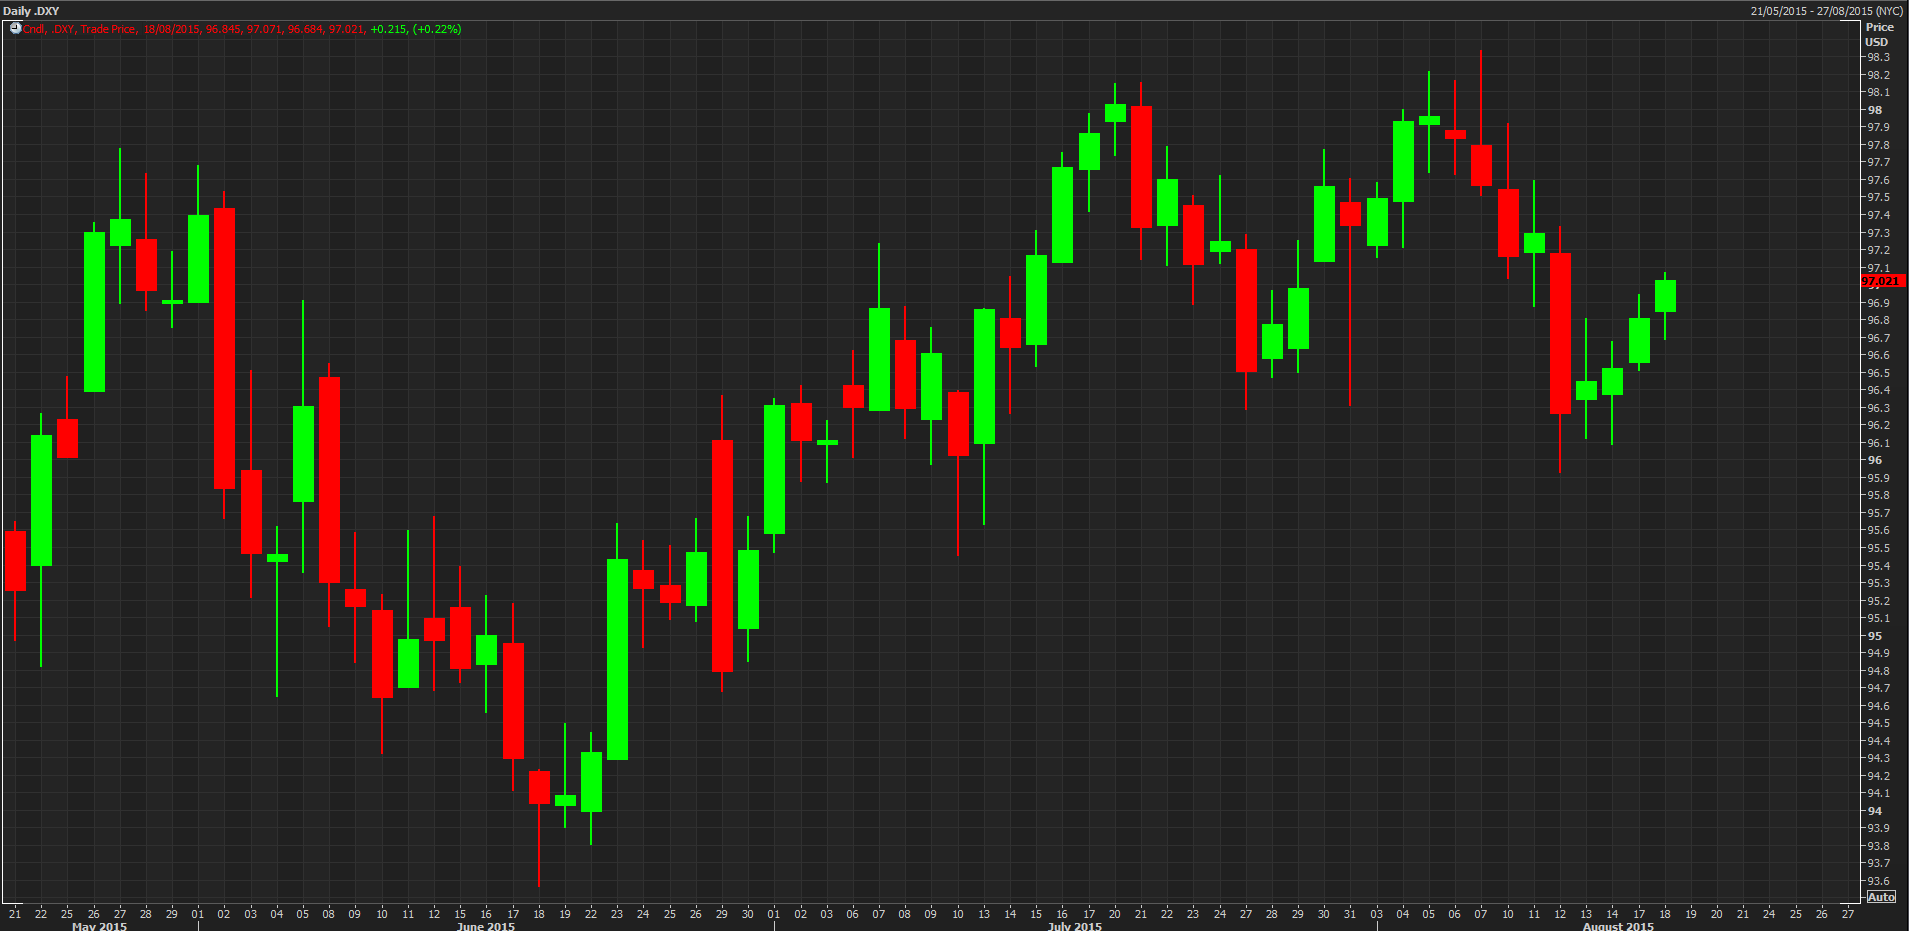
*US Dollar Index. Source – Thomson Reuters Eikon
This has been followed by consolidation over the last few weeks, which has led to the formation of a flag, typically a trend continuation pattern.
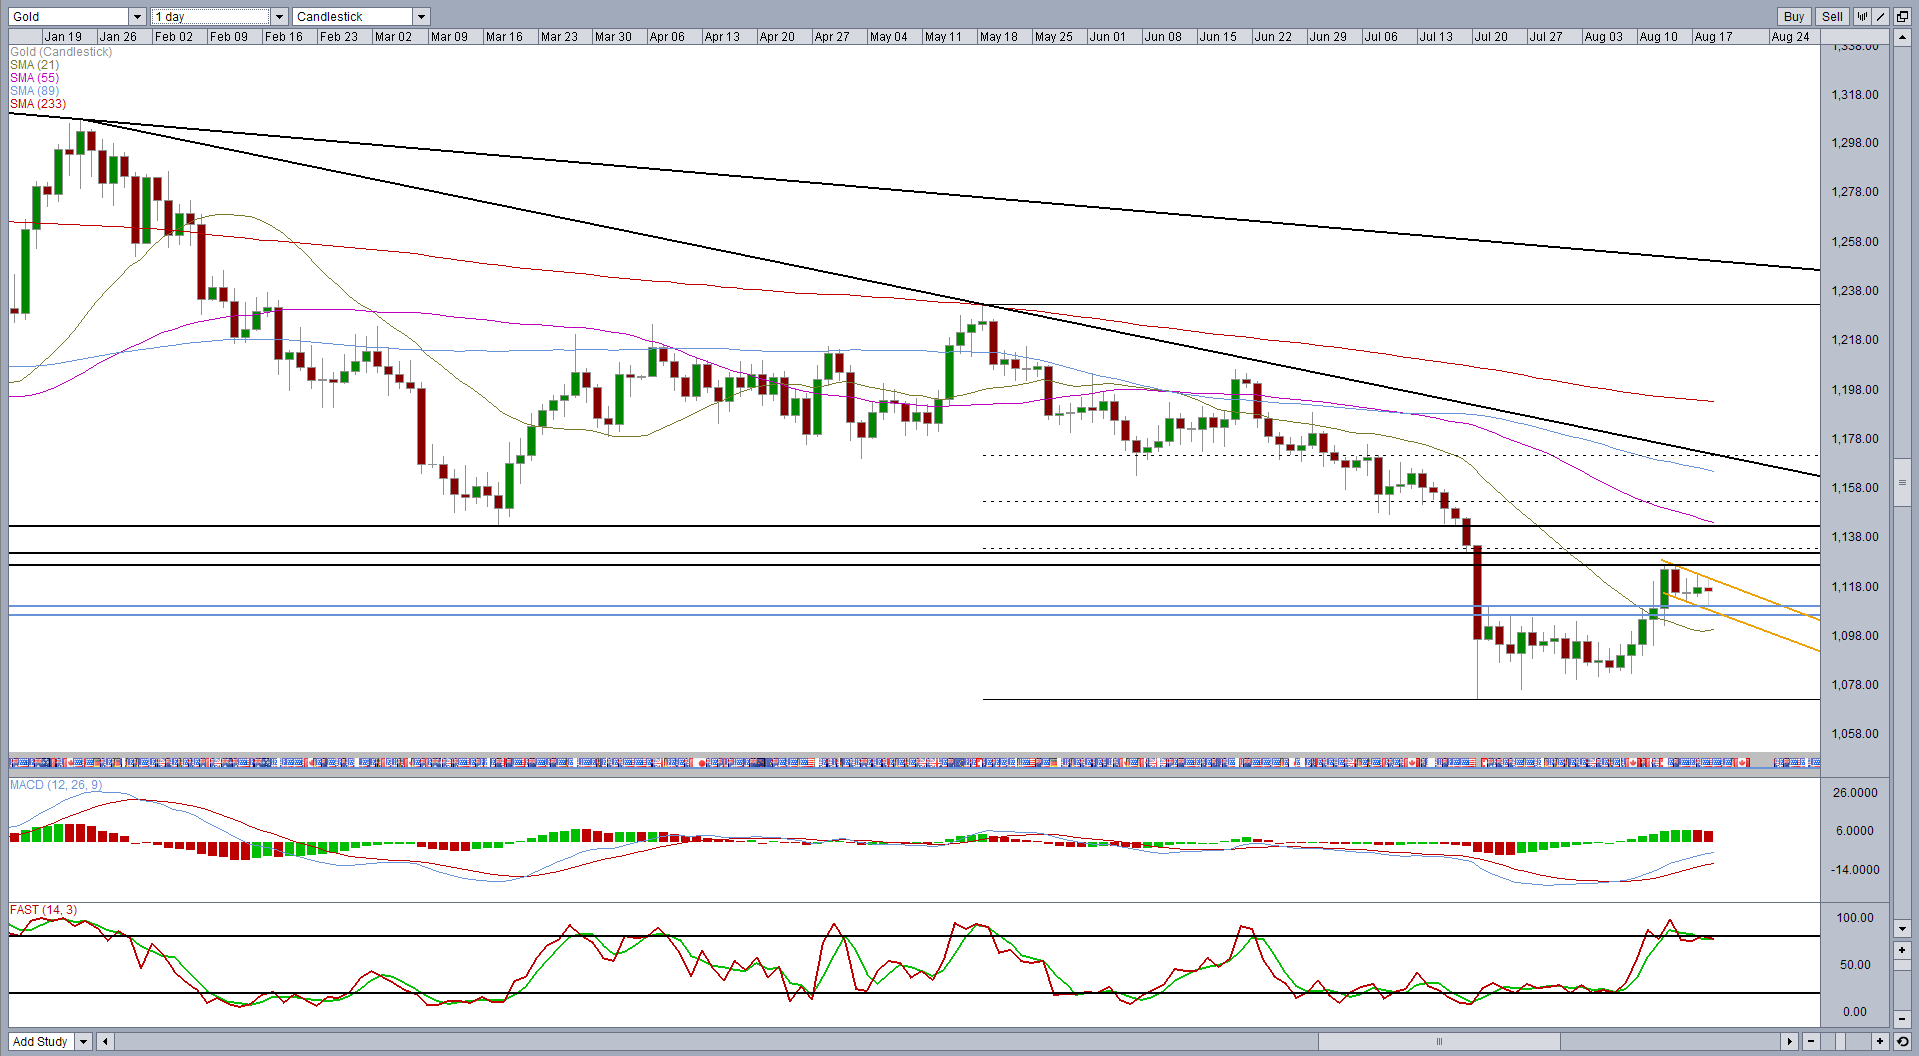
Early signs suggest this could be the case on this occasion with today’s test of the trend line support and prior resistance failing at the first attempt. The rebound off this level was very strong and could potentially be followed by a test of the trend line resistance.
Based on the size of the flag pole, a break could prompt a move towards the descending trend line which dates back to 22 January. Of course, this is dependent on a break occurring and the point of the breakout and is only a projection based on what can often occur with similar setups.
There are also a number of potential resistance levels above the flag, including last week’s high of $1,126.94, 7 November support at $1,131.50 and 17 March support at $1,142.73.
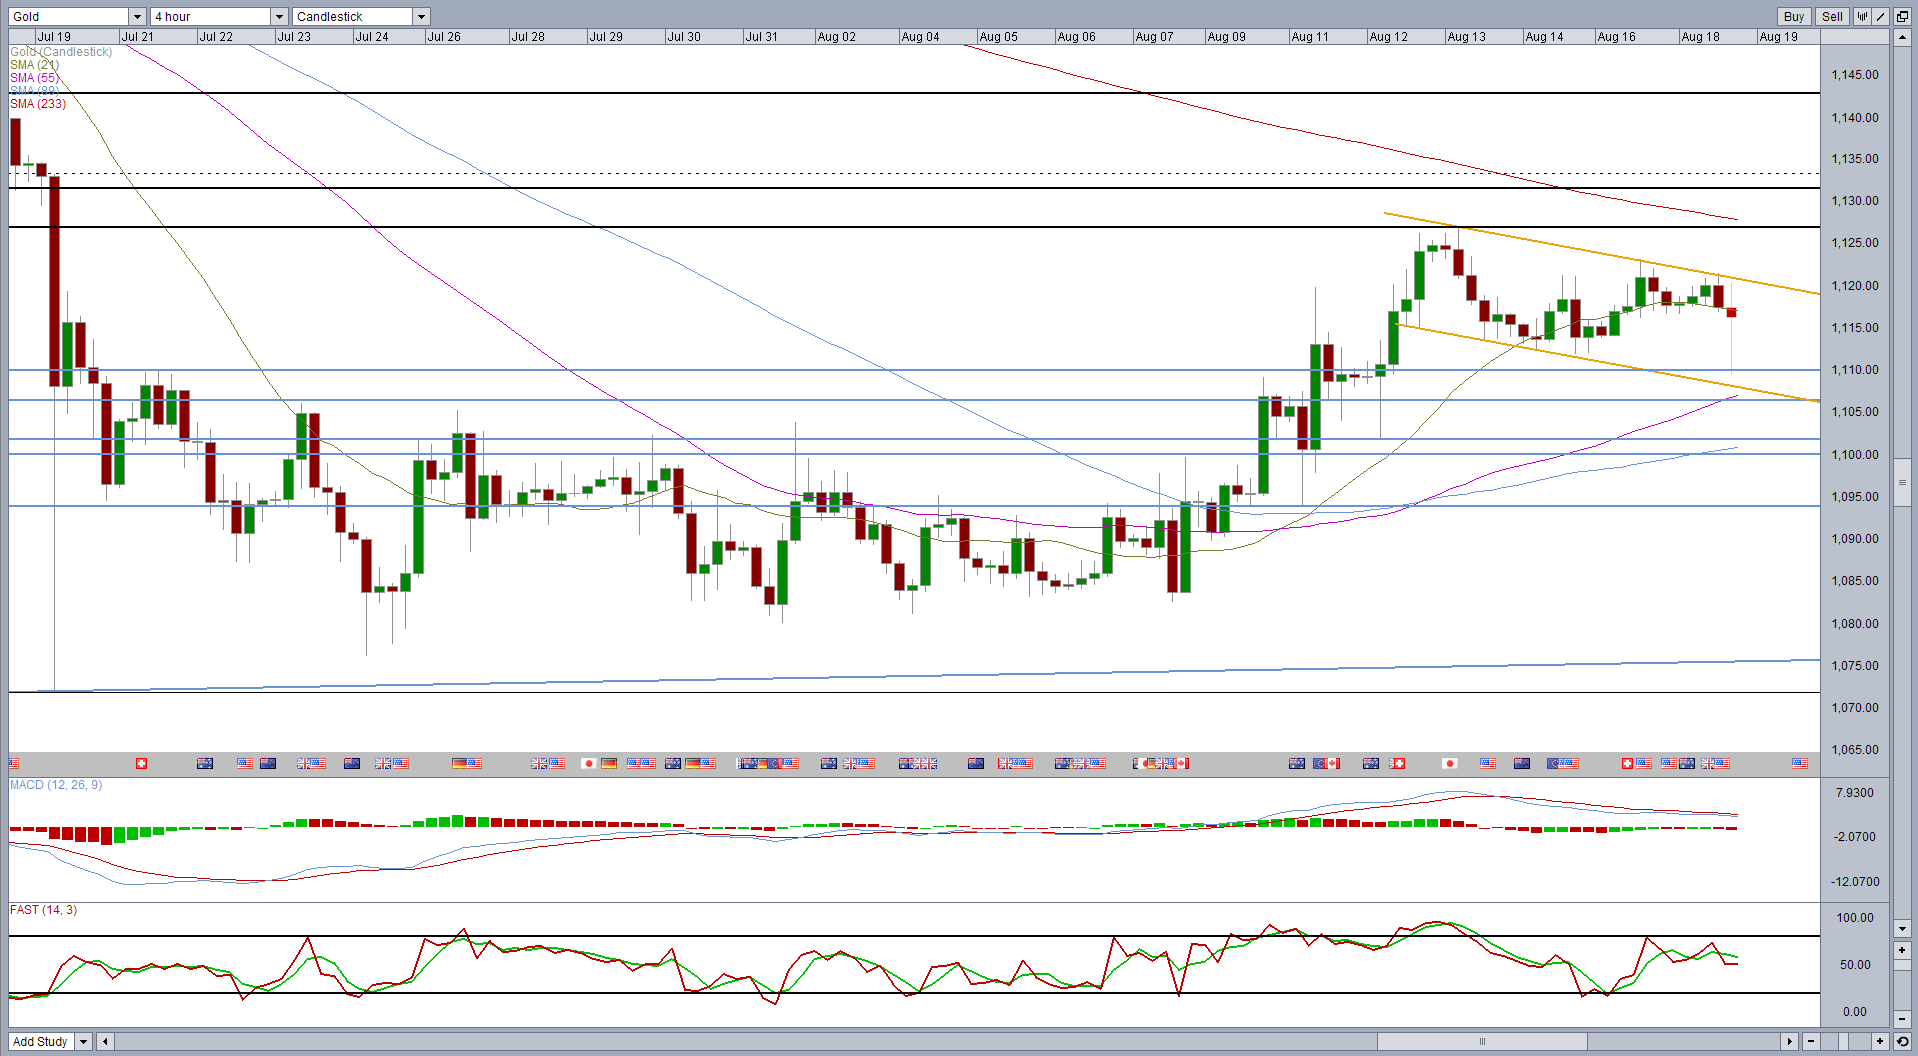
Alternatively, a break below the trend line support, which would also mean a break of previous resistance levels, would be a very bearish signal, with further support possibly being found around $1,100-$1,101.90 and $1,093.90.
Content is for general information purposes only. It is not investment advice or a solution to buy or sell securities. Opinions are the authors; not necessarily that of OANDA Business Information & Services, Inc. or any of its affiliates, subsidiaries, officers or directors. If you would like to reproduce or redistribute any of the content found on MarketPulse, an award winning forex, commodities and global indices analysis and news site service produced by OANDA Business Information & Services, Inc., please access the RSS feed or contact us at info@marketpulse.com. Visit https://www.marketpulse.com/ to find out more about the beat of the global markets. © 2023 OANDA Business Information & Services Inc.

Former Craig
Latest posts by Former Craig (see all)
- Market Insights Podcast – US GDP, RBNZ holds, bitcoin soars - 28 February 2024
- Market Insights Podcast – Nvidia earnings, record highs for stocks - 23 February 2024
- EUR/USD – A bullish breakout or just further consolidation? - 22 February 2024