The euro has been paring gains against the dollar recently and is currently on course to extend its losing streak to four days.

However, there is reason to believe that recent selling pressures could ease, opening up a continuation of the move towards the May and June highs.
Firstly, the pair did break above the descending trend line – 1 July highs – last Wednesday which indicates a more bullish sentiment in the pair.
The recent decline has seen price action retest the trend line and while it did breach it temporarily, it is trading back above here. If we see a daily close above here, it could be viewed as confirmation of the break, a bullish signal.
The most recent support, around 1.1020-1.1030, coincides with the 50% retracement of the move from 5 August lows to 12 August highs, as well as the 233-period simple moving average on the 4-hour chart, which has been a notable support and resistance level, and sentiment indicator, in the past.
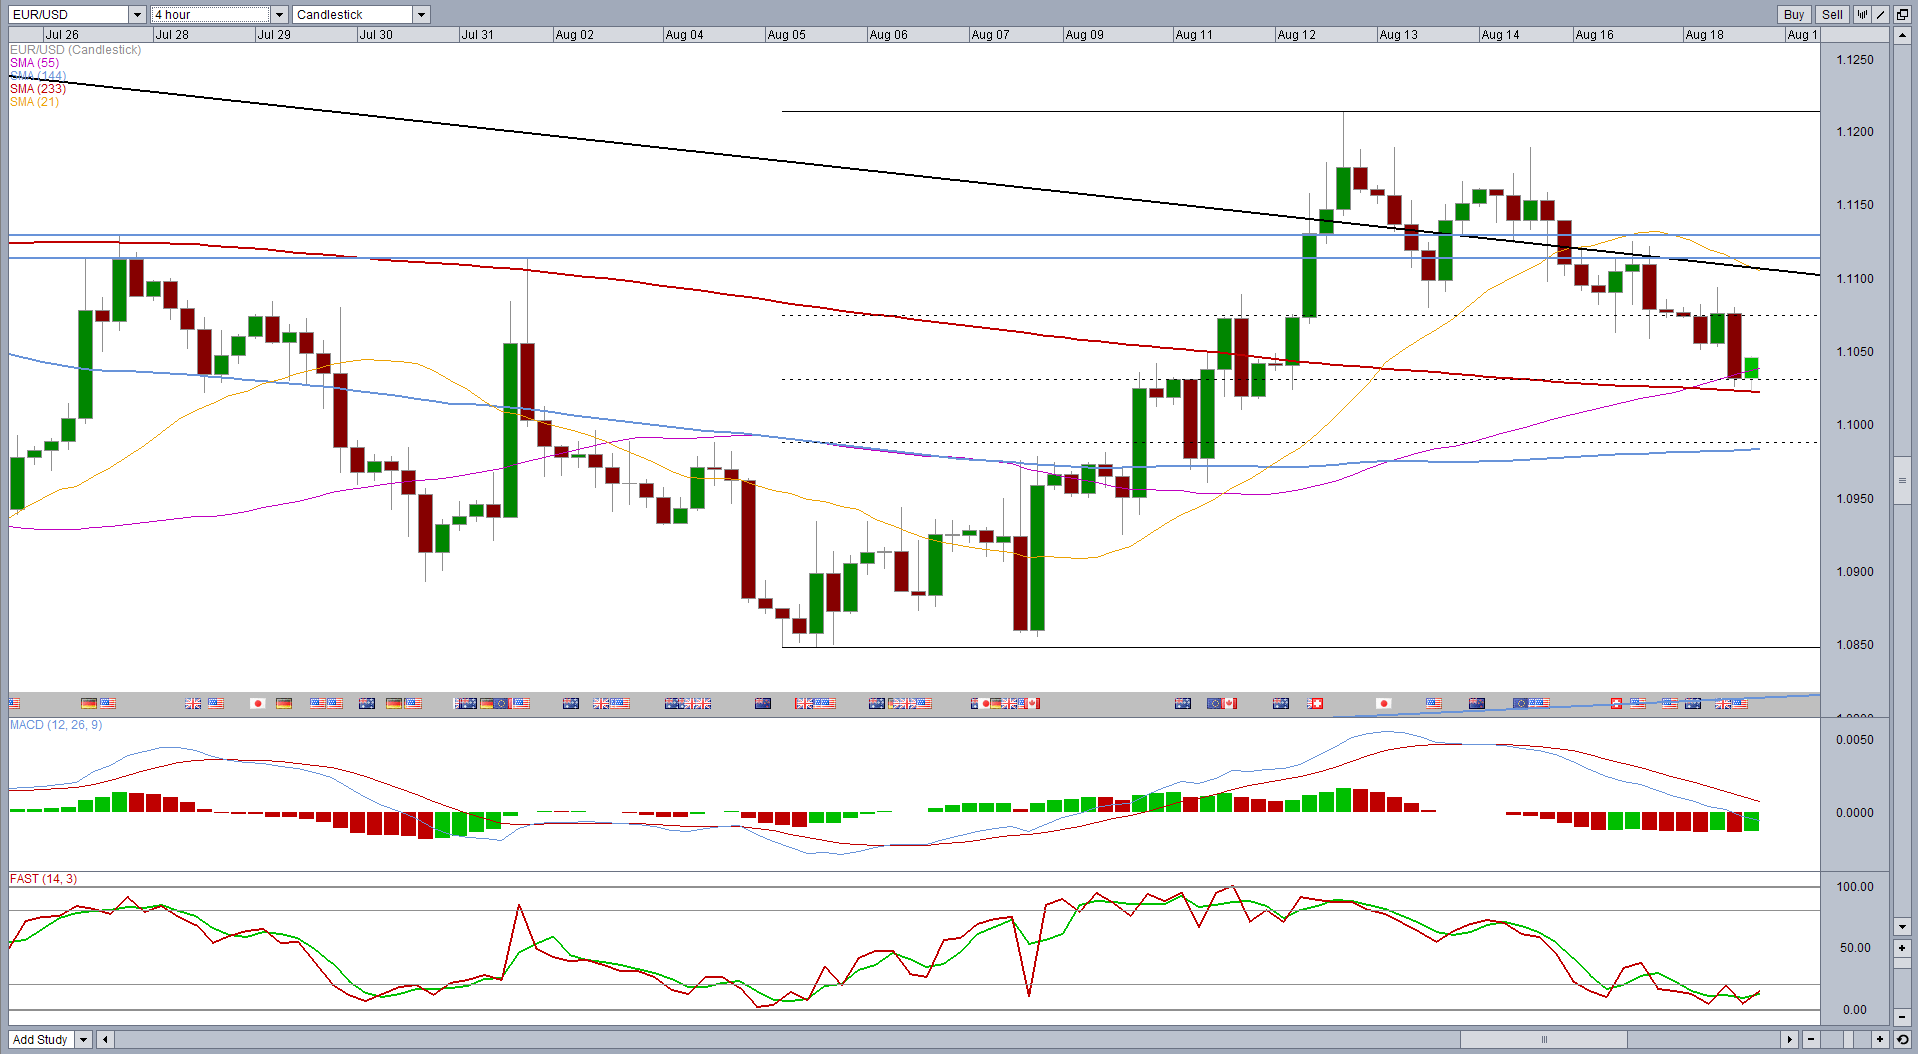
All of this suggests we could see a reversal off this level but we are yet to see any confirmation of this at this stage. We haven’t even seen any sign of trend exhaustion, which may instead just indicate a phase of consolidation and continuation of the move lower.
The last complete 4-hour candle is certainly bearish, being an almost perfect marabuzo. Moreover, the current candle has so far failed to break above the marabuzo line, which is seen as another bearish signal.
With all that in mind, while the current level would technically mark a logical reversal point for the pair, there is nothing yet to suggest this is the case. Moreover, a break below it would indicate a strong bearish bias as the pair closes back in on 1.10.
A good candle reversal setup on the 4-hour chart, such as a bullish engulfing pattern or morning star formation, would suggest the bearish move has been exhausted.
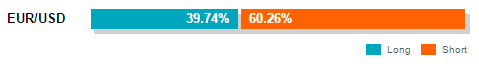
While OANDA client data suggests the net short position is being reduced which could be seen as a bullish indicator, a comparison of historic data against price below would actually indicate the opposite and support further declines. 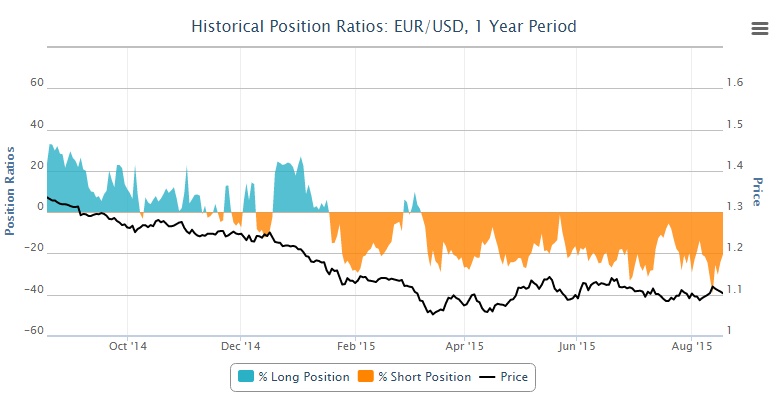 The above tools and others can be found in OANDA Forex Labs.
Content is for general information purposes only. It is not investment advice or a solution to buy or sell securities. Opinions are the authors; not necessarily that of OANDA Business Information & Services, Inc. or any of its affiliates, subsidiaries, officers or directors. If you would like to reproduce or redistribute any of the content found on MarketPulse, an award winning forex, commodities and global indices analysis and news site service produced by OANDA Business Information & Services, Inc., please access the RSS feed or contact us at info@marketpulse.com. Visit https://www.marketpulse.com/ to find out more about the beat of the global markets. © 2023 OANDA Business Information & Services Inc.

Former Craig
Latest posts by Former Craig (see all)
- Market Insights Podcast – US GDP, RBNZ holds, bitcoin soars - 28 February 2024
- Market Insights Podcast – Nvidia earnings, record highs for stocks - 23 February 2024
- EUR/USD – A bullish breakout or just further consolidation? - 22 February 2024