Yesterday I suggested that the euro was consolidating against the dollar in what appeared to be a flag formation but that there were signs that there wasn’t a huge amount of appetite for a further move to the downside (EURUSD – Remains Bearish Despite Warning Signs).
Well, the break below the flag did come but it quickly reversed the move and we failed to get a daily close below the trend line support. This further suggested that despite the apparent bearish setup, the appetite for the move was lacking. It also invalidated the flag as a bearish indicator.
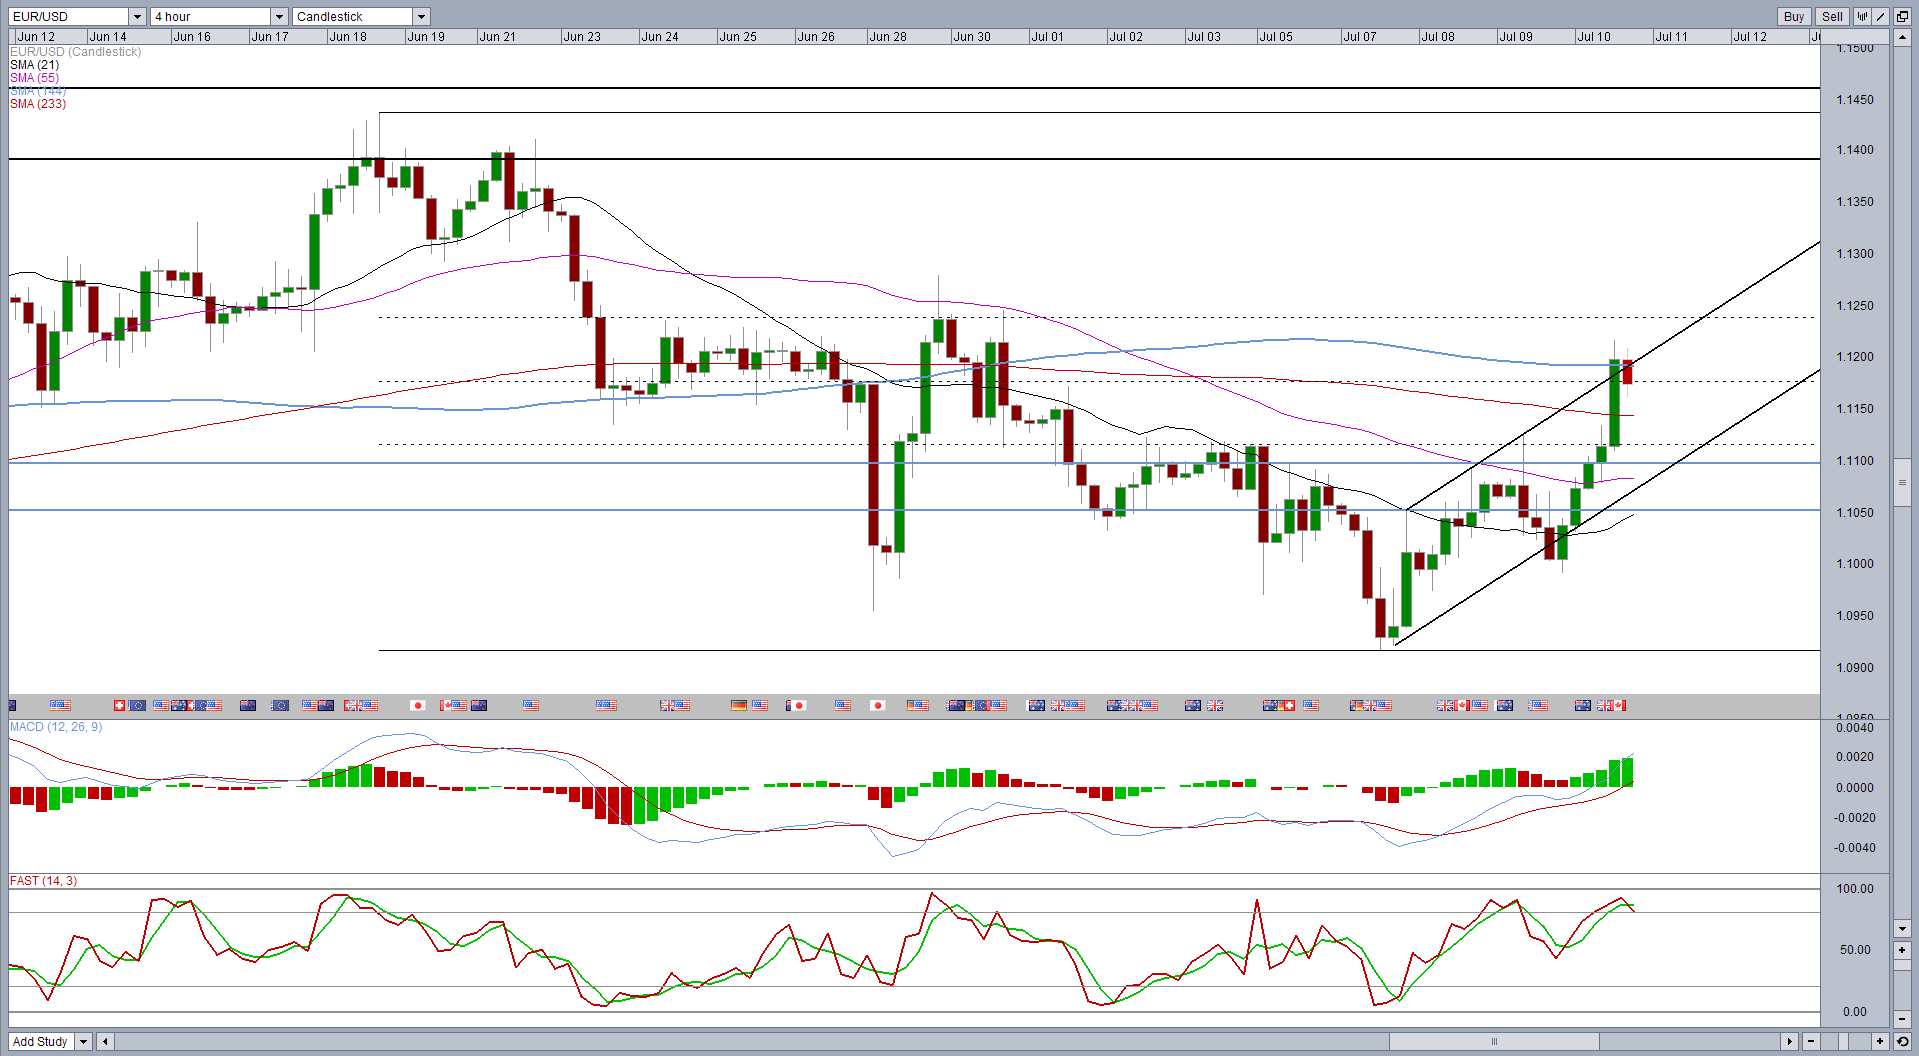
Following the false breakout, we have seen a strong push to the upside – including a break above the flag which confirmed the invalidation of the flag – and the pair now faces a key test that could offer insight into the current market bias.
The 144-day simple moving average falls between the 50 and 61.8 fib levels – 18 June highs to 7 July lows – and it has proven to be an important support and resistance level in the past. A few weeks ago, the pair briefly broke through it but the move never gained any traction.

Adding to these is the descending trend line, dating back to 14 July 2014, almost exactly a year ago. Again, this has been tested on numerous occasions but has failed to be significantly broken.
If we can see a daily close above these levels it could strongly suggest that traders are more bullish on this pair. With this in mind, it’s worth noting that we’re not seeing any divergences on the stochastic and MACD on the 4-hour chart that would hint at a bearish reversal.
A break higher would bring a key region back into focus, 1.1385-1.1525, having been a significant area of support and resistance this year. If this is broken, the pair would start to look far more bullish.
If on the other hand, the current resistance holds, it will be very interesting to see how the pair responds to two key levels, 1.0916, the most recent low, and 1.0819. Technically, the pair has made higher lows since bottoming on 13 March and while these haven’t always been followed by higher highs, it’s hard to be too bearish while this is the case.
N.B. It’s worth noting that we have seen large gaps when the markets have reopened in each of the last two weeks due to events regarding Greece over the weekend. With bailout discussions taking place again this weekend and a new deadline of Sunday being set, the same could happen again next week. It may be worth taking this into consideration if you plan to hold any positions over the weekend.
Content is for general information purposes only. It is not investment advice or a solution to buy or sell securities. Opinions are the authors; not necessarily that of OANDA Business Information & Services, Inc. or any of its affiliates, subsidiaries, officers or directors. If you would like to reproduce or redistribute any of the content found on MarketPulse, an award winning forex, commodities and global indices analysis and news site service produced by OANDA Business Information & Services, Inc., please access the RSS feed or contact us at info@marketpulse.com. Visit https://www.marketpulse.com/ to find out more about the beat of the global markets. © 2023 OANDA Business Information & Services Inc.

Former Craig
Latest posts by Former Craig (see all)
- Market Insights Podcast – US GDP, RBNZ holds, bitcoin soars - 28 February 2024
- Market Insights Podcast – Nvidia earnings, record highs for stocks - 23 February 2024
- EUR/USD – A bullish breakout or just further consolidation? - 22 February 2024