The euro has done surprisingly well against the dollar throughout all of the Greek drama, rallying towards 1.14 on a number of occasions but failing to keep the momentum above here.
It’s possible that the Greek debacle has actually acted as a distraction to the Federal Reserve and rate hike timing as it’s seen by many as a bigger risk event, which enabled EURUSD to maintain these higher levels.
Once this passes though we could see attention switch immediately back to the U.S. which could favour the dollar, with the first hike potentially coming in September. The Fed did a good job of capping dollar gains at the meeting last week by putting much more emphasis on the pace of rate hikes rather than the timing of the first but they may struggle to provide such a dovish message the closer we get to that first hike.

The pair was faced with a number of technical resistance levels late last week – 144-day simple moving average, descending trend line dating back to 14 July highs and previous support and resistance levels – so this was always looking to be an important level with large downside potential.
Monday’s sell-off was quite significant and may have marked the beginning of a broader bearish move in the pair, having broken through a number of supports and with the consolidation that has followed, left us with a rather bearish setup.
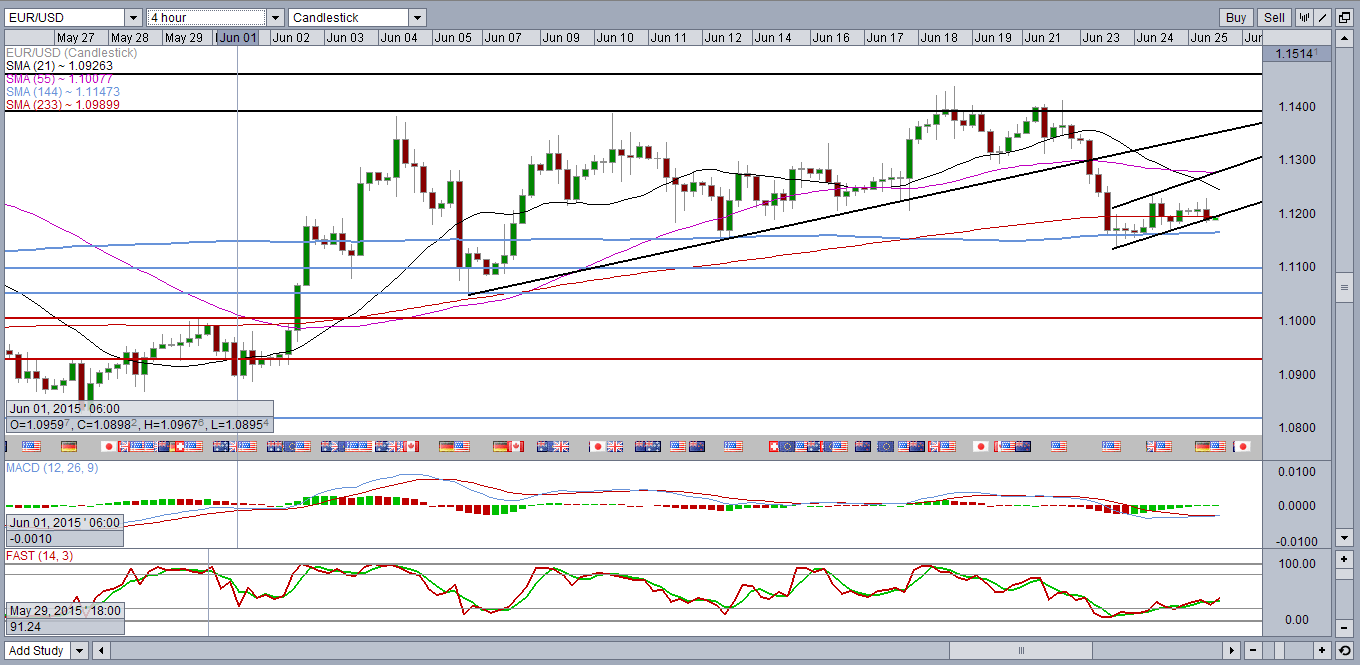
It’s not entirely clear yet whether the consolidation has given us a flag formation or a pennant but it’s not entirely relevant at this stage as they are both typically bearish. If we see a break below the trend line support, just below 1.12 at the moment, it could spark a significant move to the downside, due to the size of the sell-off the preceded it.
With a flag for example, we can often see the size of the move that makes up the “pole” projected below the break, which in this case would be very significant. Of course, any move above the flag would break this formation and render it void.
The size of the move following a successful break to the downside can be quite subjective. Depending on who you talk to, some will take the move from the top of the pole to the start of the flag – around 200 pips in this case depending on where you believe the pole begins – while others will opt for the entire pole – so around 270 pips in this case.
Alternatively, these can be used as conservative and aggressive projections and combined with other technical levels do determine price targets. In this case, the conservative projection would be 1.10 which is a key psychological level and pairs up with 29 May resistance.
If price reaches these levels, there are many technical indicators that can be used to determine the strength of the trend, such as momentum indicators – looking for divergences for example – and most importantly price action. A bullish engulfing pattern forming on 1.10 with the stochastic displaying bullish divergence for example would suggest to me the bearish move has been weakened.
*The above tools and many others can be found in OANDA Forex Labs.
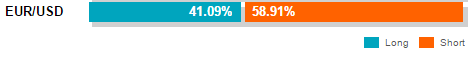
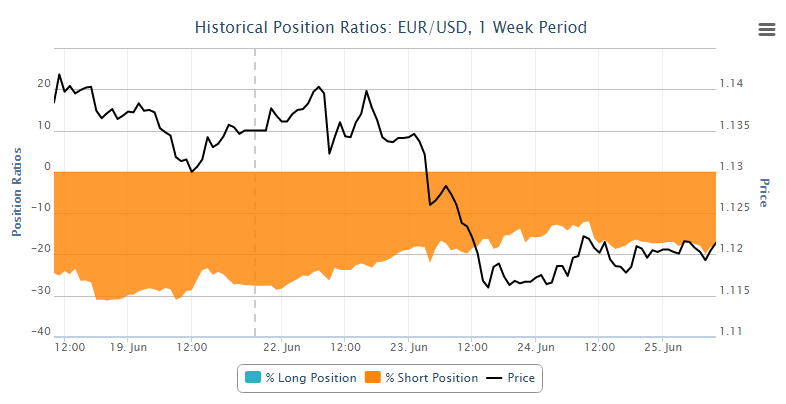
Not too much can be read from the OANDA clients positions until now as they have been net short for the entire of the June move, clearly of the belief that this rally doesn’t have the legs. Although this week, the changes in net positions have tracked the move fairly well.
Content is for general information purposes only. It is not investment advice or a solution to buy or sell securities. Opinions are the authors; not necessarily that of OANDA Business Information & Services, Inc. or any of its affiliates, subsidiaries, officers or directors. If you would like to reproduce or redistribute any of the content found on MarketPulse, an award winning forex, commodities and global indices analysis and news site service produced by OANDA Business Information & Services, Inc., please access the RSS feed or contact us at info@marketpulse.com. Visit https://www.marketpulse.com/ to find out more about the beat of the global markets. © 2023 OANDA Business Information & Services Inc.

Former Craig
Latest posts by Former Craig (see all)
- Market Insights Podcast – US GDP, RBNZ holds, bitcoin soars - 28 February 2024
- Market Insights Podcast – Nvidia earnings, record highs for stocks - 23 February 2024
- EUR/USD – A bullish breakout or just further consolidation? - 22 February 2024