WTI Crude finally appears to have stabilised over the last few weeks following a more than six month sell-off that saw it shed around 60%. After reaching the lowest levels since the first quarter of 2009 it appears a number of oil producers, particularly in the US shale industry which has played a large role in the decline, have reached tipping point and been forced to at least shelve projects aimed at maintaining or increasing production in the coming years. This is the first sign we’ve had of disruptions to the supply side and is what the OPEC members were banking on when they refused to cut production, even though in many cases prices had fallen below production costs. With many shale companies carrying large debt burdens and high drilling costs, I don’t think this is the last we’ll hear in respect to oil output expectations being cut back.
From a technical standpoint, this respite in the sell-off in oil has been a long time coming and was not wholly unexpected. As you can see on the daily chart below, we’ve been seeing a divergence between price action and the MACD for more than a month before the low was hit on 29 Jan. This should act as a red flag as lower prices being made but with slowing momentum is a strong sign that the trend is weakening, even if further lows continue to be made in price for a little longer. We were also starting to see a similar thing on the stochastic, especially once we saw divergence, a cross and a break above 20 and out of oversold territory.
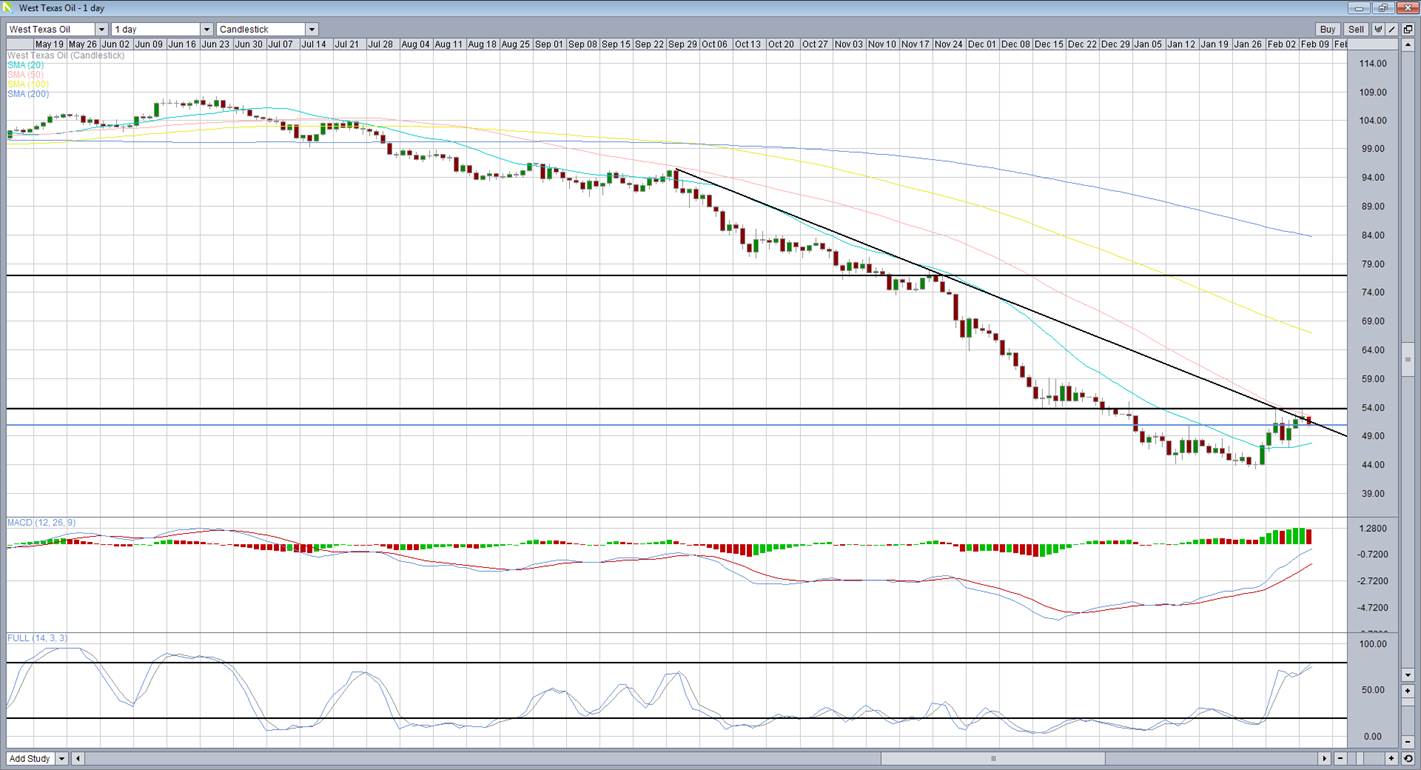
Since then we’ve been waiting for confirmation that WTI has bottomed out for now. The first sign came with the break above the 20-day SMA, which was quickly followed by confirmation of the break when it retested it from above and successfully provided support. WTI is currently trading at a very interesting level, a break of which may suggest that the recent retracement has much more to come.
Price action has already made higher lows, if it can just break above $53.87, we will have also made higher highs meaning it will be in a technical uptrend. A break of this will also see the previous support from 15 December, which until now has held, the descending trend line from 29 September and the 50-day SMA all broken. Price hasn’t been above the 50-day SMA since July last year and it has repeatedly been a reliable indicator of market bias in the past. The break of all three of these would appear to be significant and suggest the market bias is becoming more bullish.
Should we see a break above this level, the next notable resistance level would be 59.06, a previous high from 16 December, followed by 63.85, the 30 November lows. This falls around the same level as the 100-day SMA. Round numbers should also not be ignored despite not necessarily having a technical significance. When they coincide with them, as we see with 65.00 and the 20-week SMA, it’s worth paying more attention.

The problem with sell-off’s of this magnitude is when we do see a retracement, it can be more difficult to spot reliable resistance levels. In these cases, Fibonacci retracement levels can be quite useful, especially again when the levels coincide with other potential resistance levels.
Content is for general information purposes only. It is not investment advice or a solution to buy or sell securities. Opinions are the authors; not necessarily that of OANDA Business Information & Services, Inc. or any of its affiliates, subsidiaries, officers or directors. If you would like to reproduce or redistribute any of the content found on MarketPulse, an award winning forex, commodities and global indices analysis and news site service produced by OANDA Business Information & Services, Inc., please access the RSS feed or contact us at info@marketpulse.com. Visit https://www.marketpulse.com/ to find out more about the beat of the global markets. © 2023 OANDA Business Information & Services Inc.

Former Craig
Latest posts by Former Craig (see all)
- Market Insights Podcast – US GDP, RBNZ holds, bitcoin soars - 28 February 2024
- Market Insights Podcast – Nvidia earnings, record highs for stocks - 23 February 2024
- EUR/USD – A bullish breakout or just further consolidation? - 22 February 2024