Prices of 10Y Treasury Note jumped sharply higher following the NFP miss last Friday, pushing above from 124.2 to a high of 125.0 in quick fashion. Even though 125.0 round figure resistance wasn’t broken , prices managed to stay above previous swing high of 125.9, allowing for prices to finally break the 125.0 cleanly yesterday. Currently prices have pulled back significantly but we remain above 125.0, suggesting that S/T bullish pressure remains intact.
Hourly Chart
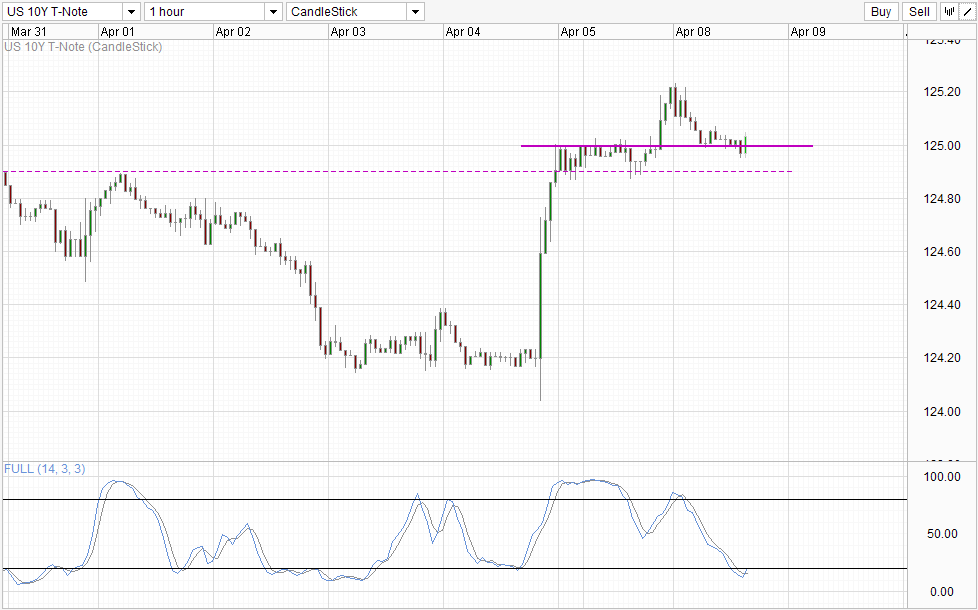
However, it should be noted that the pullback towards 125.0 started during New York midday when US stocks remained highly bearish. This is a little bit unsettling for Treasury bulls as this suggest that there are still significant bears lurking around – understandably considering that the QE tapering narrative is expected to continue. Certainly the NFP number was below expectations, but the miss wasn’t that bad at 192K vs 200K expected. It is highly unlikely that the Fed will alter their current pace of tapers, and as such we should still be expecting a fundamental drop in Treasury demands which will drive prices lower in the long run. Hence, the only reason for someone to buy Treasuries right now would be flight for safety, and that bullish pressure may not be as strong as we think.
Nonetheless, Stochastic readings do support a rebound off 125.0 as Stoch curve is currently pointing higher and looks likely to cross the 20.0 level to produce a bullish cycle signal. Hence, even though long-term pressure may be bearish, in the immediate short-term we could still see prices pushing towards recent swing high of 125.2. If we fail to even do that, then it is a huge sign that bearish pressure is strong and we may see strong bearish trend emerging from there.
Daily Chart

Daily Chart agrees with the bearish outlook, and may even be more bearish than the short-term analysis as overall bearish trend remains in play even if S/T price push above last Friday’s swing high. This is because we have Channel Top providing resistance in conjunction with resistance band from 125.3 – 125.5 in the form of historical swing lows and tops, increasing the likelihood of prices reversing from there. Stochastic indicator agrees as Stoch curve are close to the Overbought region and has tapered flatter, suggesting that a stoch reversal is not too far away.
What should traders do next? To be fair there is still potential upside risk in US10Y prices should global stocks suffer a meltdown. As such, given that global stocks are still looking bearish it may be risky to start shorting right now when the chance of current decline evolving into a full on bearish trend remains. Instead, conservative traders may be better off waiting for global risk appetite to show sign of recovery which will reduce the immediate risk of sharp selling off of stocks. Should that happen, the likelihood of 10Y prices falling will be higher and any potential snap rally in US10Y prices will be reduced.
More Links:
Gold Technicals – Back Above 1,300 But Downside Bias Remains
WTI Crude – 100.5 Support Holding Well Despite S/T Bearish Bias
S&P 500 – Strong Bearish Momentum Developing
This article is for general information purposes only. It is not investment advice or a solution to buy or sell securities. Opinions are the authors; not necessarily that of OANDA Corporation or any of its affiliates, subsidiaries, officers or directors. Leveraged trading is high risk and not suitable for all. You could lose all of your deposited funds.

Mingze Wu
Latest posts by Mingze Wu (see all)
- European Bourses Not Enjoying Bullish Winds From US Stocks - 17 April 2014
- More Aggressive Stimulus Possible Despite Premier Li’s Denial - 17 April 2014
- China March FDI -1.5% Y/Y vs +2.05% expected. First decline in more than a year. - 16 April 2014