Risk appetite is back strongly once more, with all 3 major US stock indexes growing at a pace that we expect based on their historical characteristics. First up we have Nasdaq 100 which has the highest beta (risk sensitivity) gaining a stellar 1.74%, while S&P 500 which has been more bullish than Dow Jones Industrial Average in recent years came in second at 0.70% while DJI who came in last still managed to claim a respectable +0.46%.
The reason for the bullishness has been attributed to strong manufacturing data from US. However this explanation is weak as the data wasn’t really that bullish. They are certainly healthy though to be fair, with Markit US Manufacturing PMI coming in at 55.5 while ISM Manufacturing stood grew from 53.2 to 53.7. The problem is that market expectations were actually higher – 56.0 for Markit and 54.0 for ISM numbers. Hence, we should have seen a bearish reaction from the market instead of a bullish one. Considering that Japanese Tankan Indexes were mostly below expectations, and similar trend has been seen from Chinese Manufacturing PMI gauges, the case for a bearish reaction was even greater, and the failure for any significant bearish pullback following the US disappointment is yet another sign that current market is being over-optimistic.
Hourly Chart
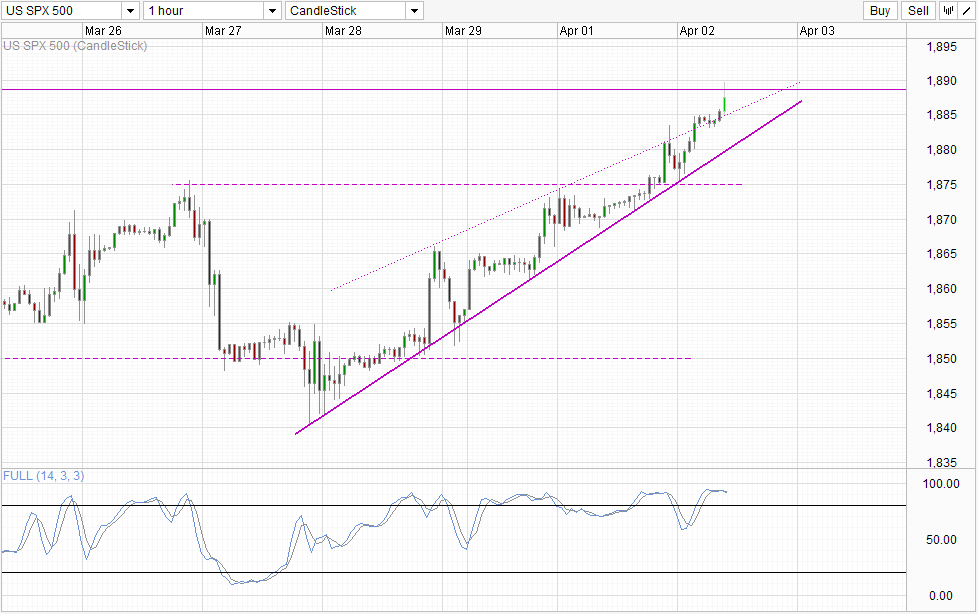
This optimism has allowed S&P 500 to not only hit the highest level but also at the same time holding the gains and closing at record high. Even though 1,890 remains elusive for now, bullish momentum remains firmly in play, and it is likely that we could see prices breaking the aforementioned level and aim for 1,900 round figure. Should we fail to see this bullish extension, then a significant bearish reprisal will be likely as current rally is not supported adequately by fundamentals. From a momentum perspective, it is clear that there hasn’t been any significant pullbacks since the rally started last Thursday, and with Stochastic readings currently at the most Overbought levels in recent weeks, sharp declines will be favored moving forward and any sign of weakness in bullish momentum may result in bears coming out in droves.
Daily Chart
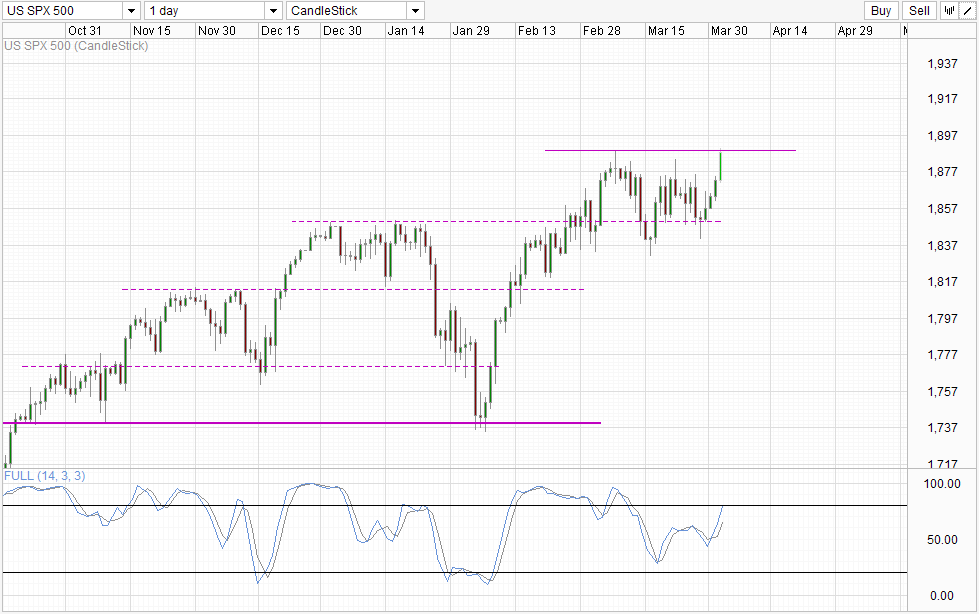
Price is more bullish on the daily chart though, and we can expect strong bullish continuation if the breakout of 1,890 is confirmed. However, should 1,890 resistance hold, then a reversal towards 1,850 becomes possible, echoing the strong short-term bearish reprisal scenario described earlier. From a momentum perspective, price still have some distance to move higher before we are deep within the Overbought region, but as Stoch curve is already bordering the resistance level, a reversal here will not be too surprising either looking at price action during mid/late Jan 2014.
More Links:
GBP/USD – Little Change As US, UK Manufacturing PMIs Dip
USD/CAD – Rangebound As Canadian Inflation Jumps
AUD/USD – Aussie Unable to Hold Onto Gains After RBA Rate Decision
This article is for general information purposes only. It is not investment advice or a solution to buy or sell securities. Opinions are the authors; not necessarily that of OANDA Corporation or any of its affiliates, subsidiaries, officers or directors. Leveraged trading is high risk and not suitable for all. You could lose all of your deposited funds.

Mingze Wu
Latest posts by Mingze Wu (see all)
- European Bourses Not Enjoying Bullish Winds From US Stocks - 17 April 2014
- More Aggressive Stimulus Possible Despite Premier Li’s Denial - 17 April 2014
- China March FDI -1.5% Y/Y vs +2.05% expected. First decline in more than a year. - 16 April 2014