Three strikes and you are out?
If that is the rule then we should be ready for a bearish sell-off in WTI Crude as bulls were given 3 shots to establish real estate above 100.0 and they have failed each time. To make matters worse, it seems that bullish effort is just getting worse and worse with subsequent attempts failing to reach previous heights.
However, we cannot fault the bulls for not trying, for certainly their efforts are valiant. Prices actually dipped below 99.5 yesterday but quickly recovered, pushing back above 100.0 and reaching a new day high. It is also worth stating that the rally came at a time when US stocks were pushing lower, highlighting the tremendous efforts mustered by WTI bulls to go against “risk off” flows. Nonetheless, sometimes we just have to admit that the best may not be good enough, and in this case bulls are still bested by overwhelming bearish pressure which sent prices down in equally quick fashion once more.
Hourly Chart
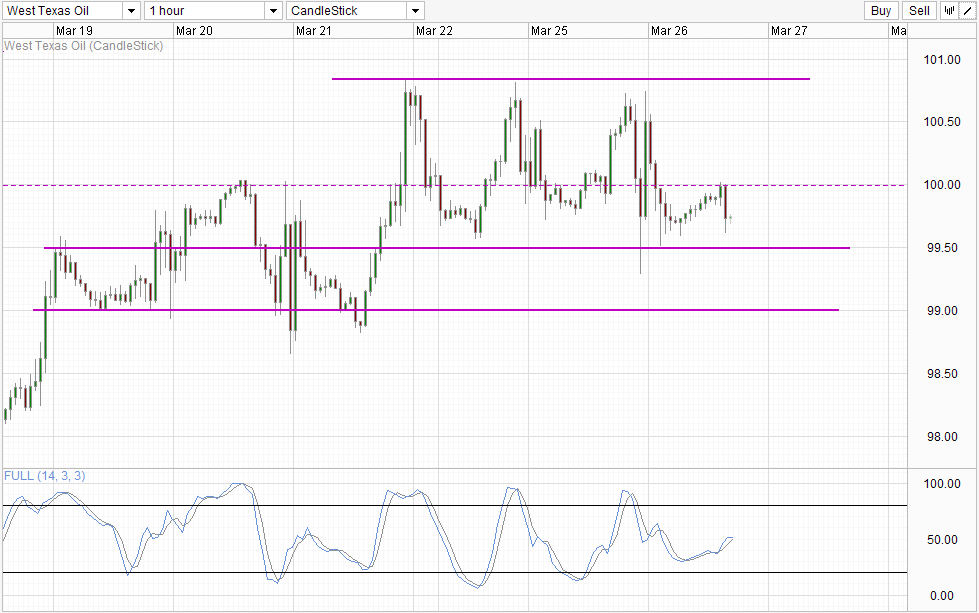
What does this mean for WTI moving forward? Firstly, the 3 Strikes and you are out rule does not apply to financial markets, but certainly the repeated failures to climb back higher suggest that bearish pressure is strong. With prices appearing to be unable to break 100.0 right now, it is reasonable to expect prices to move towards 99.5 and perhaps even all the way to 99.0 in the near future. If risk appetite start to erode, the pace of decline in WTI may be even faster.
Stochastic indicator also favours bearish scenario. Stoch curve appears to have flattened and looks set to reverse lower around the 50.0 “resistance” level, suggesting that prices are reverting back to the bearish cycle which increases the likelihood of a move towards 99.5. It may be a stretch to hit 99.0 though as the bearish cycle is already halfway done, and a breach of 99.0 will be even tougher in the immediate future.
Daily Chart
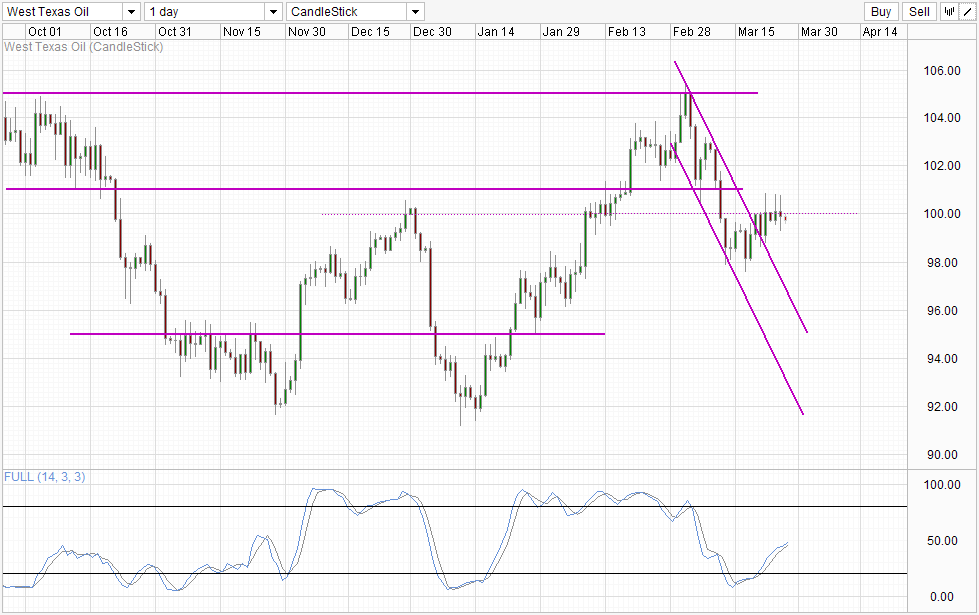
Daily Chart highlights the failure of bulls even more as stronger bullish follow-through was expected following the breakout of the descending Channel. However, the failure to do so suggest that the bearish momentum may still be in play and that recent rally from 98.0 may simply be a correction rather than a reversion back into the rally which started in Jan 2014. Stochastic indicator may be pointing higher, but Stoch curve will need to break “resistance” around 50.0, and even in the event that Stoch curve does manage to fulfil the entire bullish cycle proper, it is unlikely that 102.0 round figure will be broken and hence the push from 98.0 will still look “corrective” in nature and overall bearish pressure from the 105.0 decline will still remain in play.
More Links:
EUR/USD Technicals – Bearish Momentum Seen In S/T But No Clarity In Long-Term Direction
S&P 500 – Recovered But Remain Under Pressure
GBP/USD – Slight Gains As British CPI Matches Expectations
This article is for general information purposes only. It is not investment advice or a solution to buy or sell securities. Opinions are the authors; not necessarily that of OANDA Corporation or any of its affiliates, subsidiaries, officers or directors. Leveraged trading is high risk and not suitable for all. You could lose all of your deposited funds.

Mingze Wu
Latest posts by Mingze Wu (see all)
- European Bourses Not Enjoying Bullish Winds From US Stocks - 17 April 2014
- More Aggressive Stimulus Possible Despite Premier Li’s Denial - 17 April 2014
- China March FDI -1.5% Y/Y vs +2.05% expected. First decline in more than a year. - 16 April 2014