The US stock markets seemed to be back to normal. S&P 500 gained 0.72% yesterday, while Dow Jones Industrial Average which has been the less bullish of the 2 in recent years grew 0.55%. Tech heavy Nasdaq 100 which has been historically most bullish during uptrend was similarly the strongest of them all yesterday gaining 1.20%. The fact that all 3 stock indexes correlation performed “correctly” suggest that market bullish sentiment is “accurate”, and risk of a bearish pullback is unlikely at least from a sentiment perspective.
This is important because fundamentals are once again found wanting. There wasn’t anything substantial that could have pushed US stocks higher yesterday. US Consumer Price Index (Y/Y) was lower than expected, while Building Permits did grow 7.7% versus 1.6% expected M/M, but Housing Starts figure actually shrank 0.2% vs an expected 3.4% gain. Net Long-Term TIC Flows was also much lower than expected in Jan, accounting for only $7.3B vs $40.0B forecast and unable to make up for Dec’s fall of 45.9B. Hence it is difficult to justify yesterday’s rally on broad economic fundamentals. In terms of geo-political situations, the situation in Ukraine isn’t exactly diffusing either as Russian President has officially informed Parliament of Crimea’s request to join Russia, with a parliamentary vote expected to ratify this request. Hence, we are actually one step closer to actual economic sanctions by EU and US on Russia (and not current “sanctions” on Russian and Crimean individual leaders) which should have a bearish impact on global risk appetite as a whole.
Given all these bearish factors, the rally certainly is inexplicable and therefore it is at least heartening to see that bullish sentiment is at least looking “legit” for now.
Hourly Chart
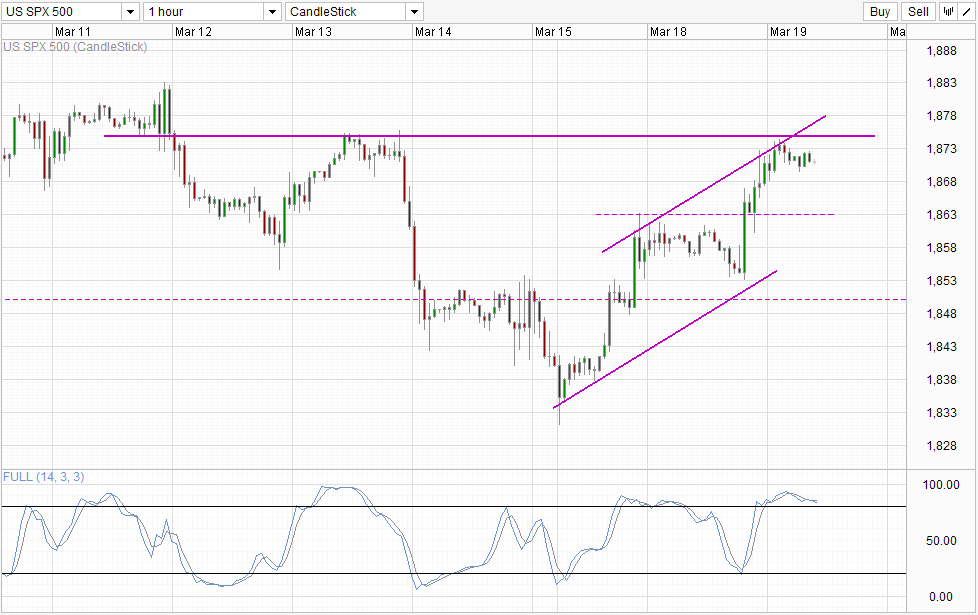
Nonetheless, a machine cannot keep running on hot air, and with prices currently facing the combined resistance from 1,875 and Channel Top, it is unlikely that unwarranted rallies can last longer. Stochastic indicator agrees with Stoch curve already within the Overbought region and is threatening to head lower and give us a bearish cycle signal. Hence, even if bullish sentiment does continue to be in play in the next few days or even in the next couple of weeks, a temporary bearish pullback for now is in the cards.
Daily Chart
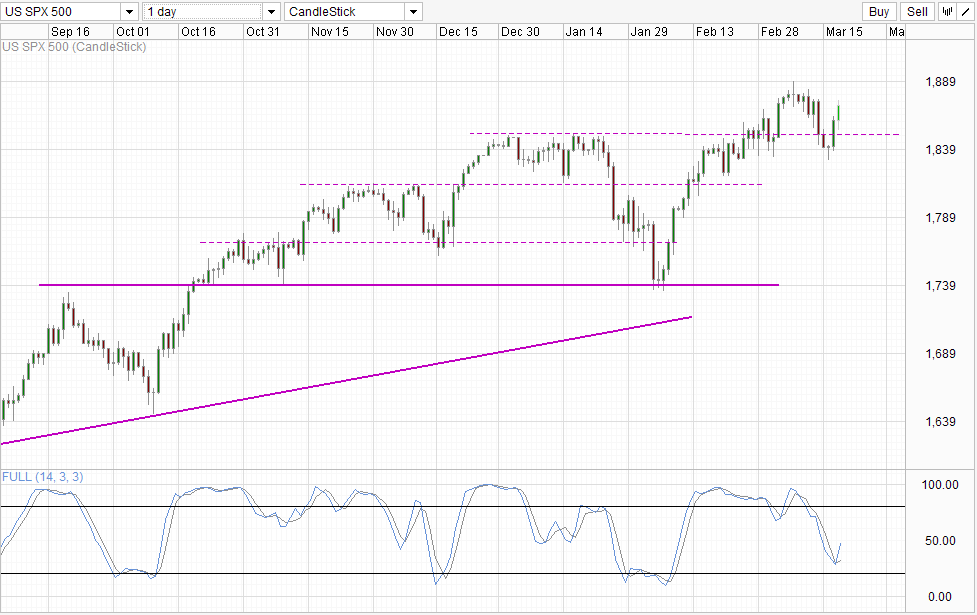
Daily Chart remains bullish though, with a strong bullish candle to follow up with the Morning Star pattern formed in conjunction with the 1,850 break. Stochastic indicator is also clearly pointing higher suggesting that a bullish cycle is underway right now and a move towards 1,890 should be contemplated minimally.
As such, we have a dilemma – follow signs of strong bullish sentiment and technicals, or stay away from it as fundamentals are weak? The choice is yours, but shorting right now when momentum is clearly on the upside may be the most risky position to take even though a bearish reversal – should it ever happened – may be spectacular.
More Links:
GBP/USD – Pound Lower As Nervous Markets Follow Ukrainian Saga
USD/CAD – Little Movement As Canadian Manufacturing Sales Shines
AUD/USD – Steady After RBA Minutes
This article is for general information purposes only. It is not investment advice or a solution to buy or sell securities. Opinions are the authors; not necessarily that of OANDA Corporation or any of its affiliates, subsidiaries, officers or directors. Leveraged trading is high risk and not suitable for all. You could lose all of your deposited funds.

Mingze Wu
Latest posts by Mingze Wu (see all)
- European Bourses Not Enjoying Bullish Winds From US Stocks - 17 April 2014
- More Aggressive Stimulus Possible Despite Premier Li’s Denial - 17 April 2014
- China March FDI -1.5% Y/Y vs +2.05% expected. First decline in more than a year. - 16 April 2014