US stocks traded lower yesterday led by a surprise decline in Chinese exports numbers released over the weekend. Dow Jones Industrial Average fell by 0.21% while S&P 500 was doing slightly better at -0.05%. A decline in stock was already highly expected as Asian counterparts were trading deeply in the red with Nikkei 225 shedding well over 1% and China CSI 300 index falling to multi-year lows. What is actually surprising is that US stock prices did not push much lower. In fact, risk sensitive Nasdaq 100 index actually traded marginally higher (+0.08%) for all the talks about risk appetite being bearish due to China economic woes.
Hourly Chart
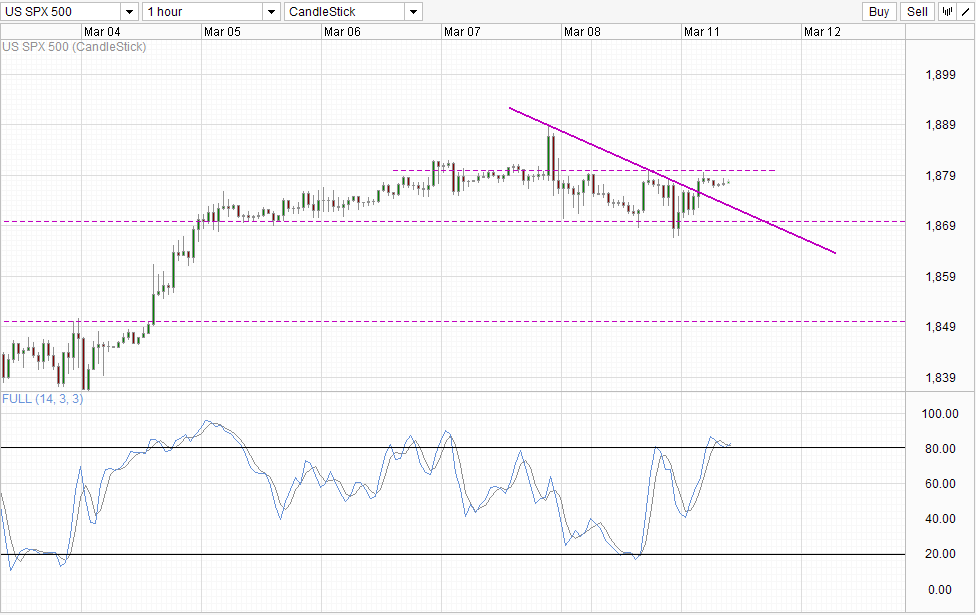
Furthermore, we can see from S&P 500 futures that prices actually recovered and even even traded above Friday’s closing level at one point during early European hours. This move is totally inexplicable as there wasn’t any economic news releases during the period to justify a shift in market sentiment. Hence, the only reasonable explanation would be that overall market sentiment for US stocks remains broadly bullish, with traders still looking out for bargain buys. This assertion would explain why prices rebounded strongly not once but twice yesterday around 1,870 soft support.
However, global sentiment remains bearish, and as such we should only expect US stocks (S&P 500 in this case) to be better supported rather than outright climbing much higher. Technicals agree in this regard, with price finding difficulty breaking 1,880 resistance. Stochastic indicator also suggest that bullish momentum may find further bullish endeavours unlikely as momentum is already Overbought with a bearish cycle signal liking to be triggered in the near future. This implies that a move towards 1,870 is possible, giving us a sideways trend in the short-term until global risk appetite starts to build up once again or if sentiment of US stocks shift.
Daily Chart
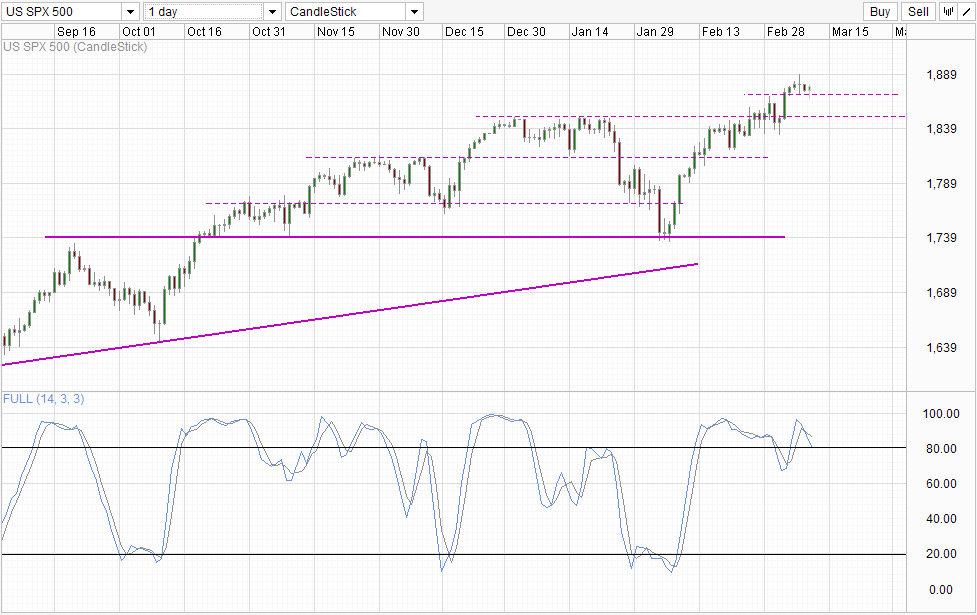
Looking at daily chart, it is easy to understand why traders are still bullish, as price action suggest that bullish momentum remains strong with a fresh bullish breakout only happening just last week, negating the threat of a top forming around 1,850. However, it should still be noted that current bullish momentum is actually rather overbought as we have not seen a significant pullback in prices since the start of the current bull run from late 2012/early 2013. If we use the widely accepted definition of a continuous bull trend (no 20% correction in between rallies), then this trend has been going close to 5 years, which is considered a relatively long run going by historical data. Furthermore, it should be noted that this bull run has been funded by borrowed money – margin debt purchases. All these increases high downside risk moving forward and traders will definitely need to be prepared for huge sharp drops moving forward should they choose to join in the bullish momentum so late in the game.
More Links:
AUD/USD – Ready to Test Key Level at 0.90 Again
EUR/USD – Remains Steady Below Resistance Level at 1.39
This article is for general information purposes only. It is not investment advice or a solution to buy or sell securities. Opinions are the authors; not necessarily that of OANDA Corporation or any of its affiliates, subsidiaries, officers or directors. Leveraged trading is high risk and not suitable for all. You could lose all of your deposited funds.

Mingze Wu
Latest posts by Mingze Wu (see all)
- European Bourses Not Enjoying Bullish Winds From US Stocks - 17 April 2014
- More Aggressive Stimulus Possible Despite Premier Li’s Denial - 17 April 2014
- China March FDI -1.5% Y/Y vs +2.05% expected. First decline in more than a year. - 16 April 2014