Price action on the S&P 500 was broadly similar to that of Monday and Tuesday. We saw prices pushing above 1,850 during Asian afternoon/Early European session yesterday but prices quickly headed lower subsequently – dragged by European stocks which mostly traded lower. Risk appetite took further blows when a weaker than expected UK GDP came in lower than expected on a Y/Y basis, dragging S&P 500 all the way below 1,850 and hitting just under 1,844-1,845 support.
One wonders if the aforementioned support would have been broken if not for the fact that stronger US New Home Sales numbers were released just when the support level was tested. Prices surged back up above 1,850 but wasn’t able to hold onto the gains, and we were back below 1,844 once again with bears appearing even stronger than before – pushing to a low of 1,840 whereas the previous test only gave a low of 1,482. This highlights the overall bearishness of S&P 500 right now, a move that is really not too surprising as the fundamentals for stocks has been weak for a long time to say the least. On a side note, the bullish response following the better than expected Home Sales Numbers suggest that the contrarian behavior of Tuesday with regards to Consumer Confidence is no longer in play.
Hourly Chart
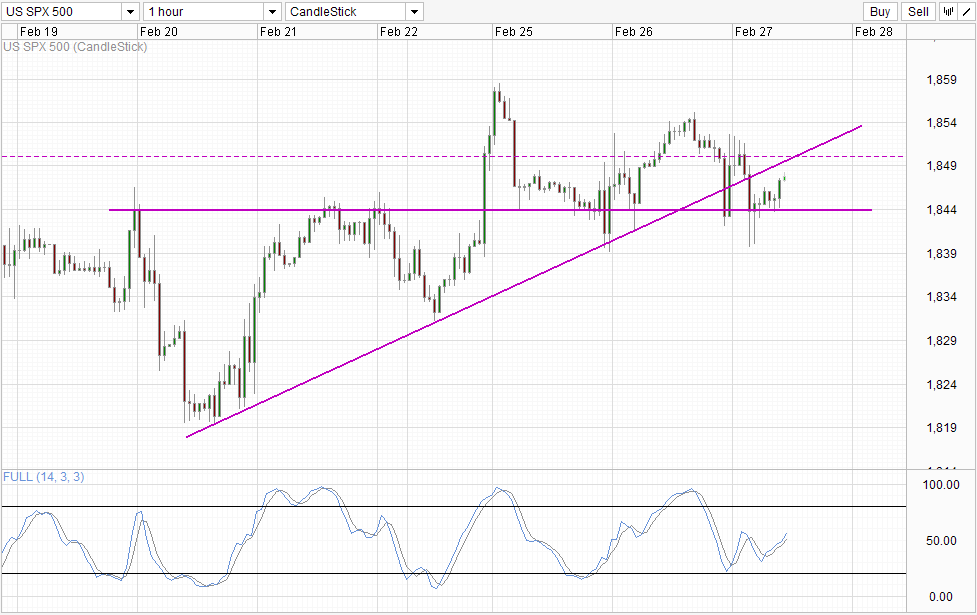
Currently price is moving towards 1,850 once more but certainly the S/T bullish momentum that started on 20th Feb is much weaker than before especially since we are now on the underside of the rising trendline. As such, the likelihood of 1,850 being broken is lower and the case for a return back to 1,844 is stronger. That being said, there is no guarantee that price will then be able to break 1,844 and preferably 1,840 conclusively to bring about a short-term bearish correction. This is because prices have been running on hot air for some time and we could still see some residual bullish pressure remaining to keep prices supported. Hence traders who wish to short US stocks may need to hold their horses until stronger confirmation (e.g. break of 1,840) appears.
Daily Chart
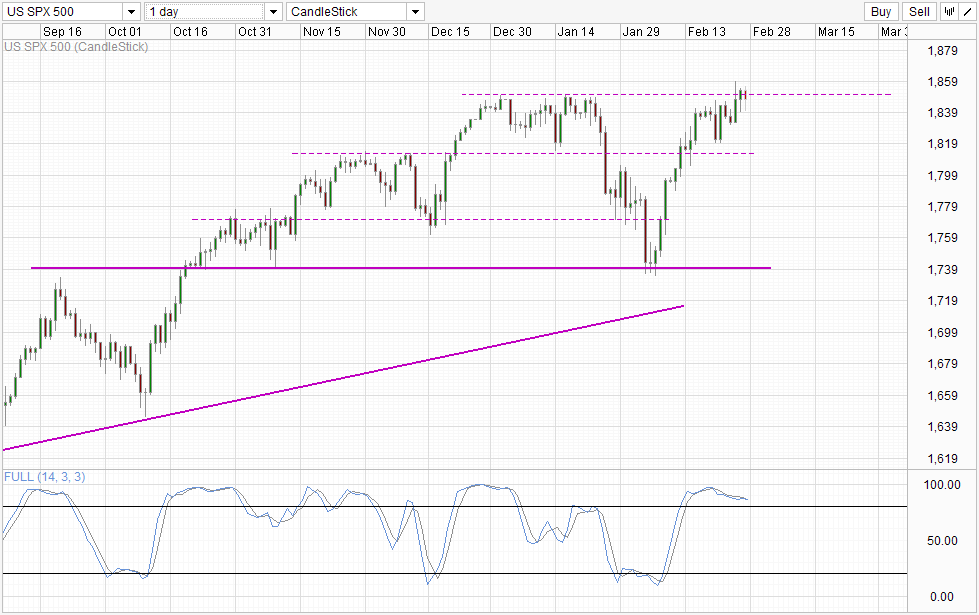
The potential is there to be fair. If this top is confirmed on the Daily Chart, we should be able to see prices moving all the way to 1,812.5 or close to there without impairing the long-term bull trend. If this develops into the bearish reversal we have been waiting for, we could easily see correction all the way to the next level of support around 1,770 and even 1,740 and beyond. With Stochastic curve already topping, the signs are already there for a bearish cycle to take flight, and we’re simply awaiting the confirmation that a top is in play.
More Links:
GBP/USD – Receives Solid Support at 1.66
AUD/USD – Continues to Trade Around Key 0.90 Level
EUR/USD – Drops Sharply Below Key Level of 1.37
This article is for general information purposes only. It is not investment advice or a solution to buy or sell securities. Opinions are the authors; not necessarily that of OANDA Corporation or any of its affiliates, subsidiaries, officers or directors. Leveraged trading is high risk and not suitable for all. You could lose all of your deposited funds.

Mingze Wu
Latest posts by Mingze Wu (see all)
- European Bourses Not Enjoying Bullish Winds From US Stocks - 17 April 2014
- More Aggressive Stimulus Possible Despite Premier Li’s Denial - 17 April 2014
- China March FDI -1.5% Y/Y vs +2.05% expected. First decline in more than a year. - 16 April 2014