Kiwi dollar rallied strongly after latest CPI numbers were released, showing that inflation rate in New Zealand has once again beat expectations just like previous quarter. Q4 CPI gained 0.1% versus consensus estimate of 0.0%. However, Q4 inflation is the lowest that we’ve seen in the past 4 quarters. Hence, speculative bets that Central Bank will be more likely to hike rates on 30th Jan may be a tad optimistic considering that CPI of the previous quarter was at +0.9%. Furthermore, it should be noted that the analysts consensus estimate was actually rather diverse and ranges from -0.3% all the way to +0.4%. Hence, it may be more accurate to say that CPI is within analysts expectations, and it is likely that RBNZ will be rather comfortable with this quarter’s CPI print even though RBNZ has never really said that they were concern with inflation to begin with (key issue is actually housing prices, not broad based inflation).
Hourly Chart
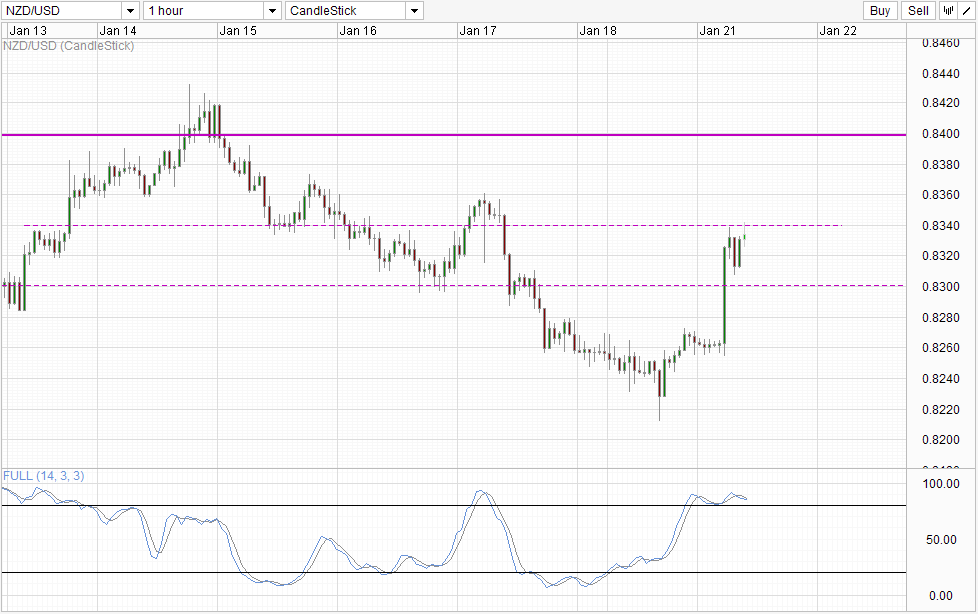
However, NZD/USD trading higher is a fact, and in this case this highlights the underlying bullish sentiment that allowed traders to overreact to the CPI data. It is likely that broad risk appetite which sent all major Asian equity indices higher this morning helped fuelled the rally as well, allowing NZD/USD to move from 0.826 to a high of 0.834. Right now price is testing the 0.834 resistance once more, but Stochastic indicator is not favourable with bullish scenarios as stoch levels are deep overbought and is pointing lower currently. Also, given that the case for NZD/USD to rally on this CPI number is weak, we should be seeing a more significant bearish pullback moving forward.
That being said, to short right now may be risky as well due to broad positive risk appetite. Hence, traders may wish to wait for further confirmation e.g. break of 0.83 before ascertaining that the previous bearish momentum that started on 14th Jan is getting back in play.
Daily Chart
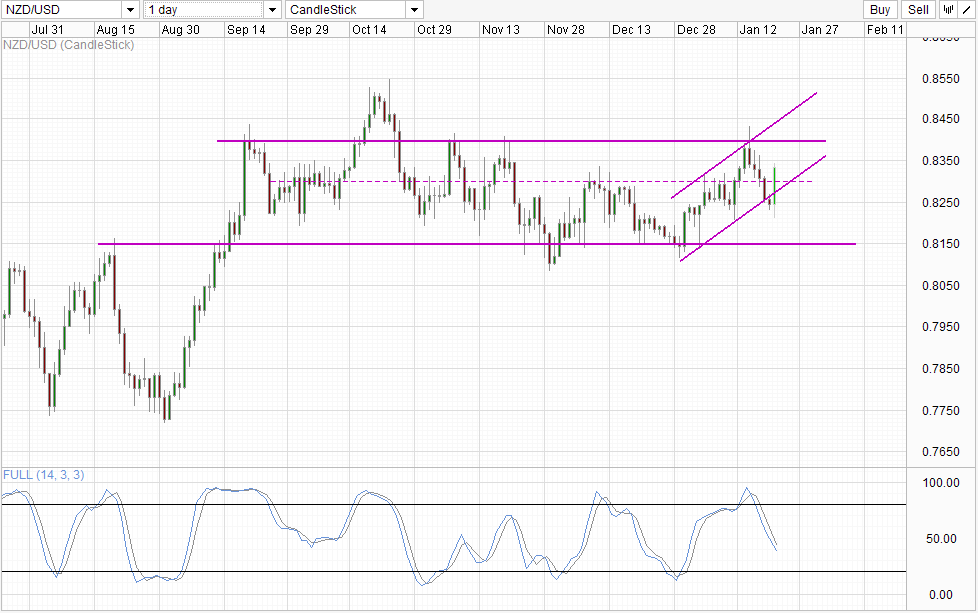
Daily Chart is more bullish though, as prices has managed to break back into the rising Channel, increasing the likelihood of prices testing 0.84 ceiling. Nonetheless Stochastic curve remains firmly bearish, and considering that prices have not managed to reach close to 0.815 before rebounding, the bearish rejection off Channel Top and confluence with 0.84 resistance isn’t invalidated yet. Then again, there have been precedence where prices started pushing higher after tagging 0.822 soft support (seen on 25th Sep, 11th Oct, 31st Oct). As such, Daily chart also affirms that it will be risky to short NZD/USD from here and conservative traders may wish to wait for further confirmation such as the break of Channel Bottom for a higher possibility of price hitting 0.815.
More Links:
AUD/USD – Trying to Hold Above 0.88
GBP/USD – Resistance at 1.6450 Stands Tall
EUR/USD – Settles Around 1.3550
This article is for general information purposes only. It is not investment advice or a solution to buy or sell securities. Opinions are the authors; not necessarily that of OANDA Corporation or any of its affiliates, subsidiaries, officers or directors. Leveraged trading is high risk and not suitable for all. You could lose all of your deposited funds.

Mingze Wu
Latest posts by Mingze Wu (see all)
- European Bourses Not Enjoying Bullish Winds From US Stocks - 17 April 2014
- More Aggressive Stimulus Possible Despite Premier Li’s Denial - 17 April 2014
- China March FDI -1.5% Y/Y vs +2.05% expected. First decline in more than a year. - 16 April 2014