The most followed US stock index had a tumultuous day. S&P 500 Futures climbed aggressively around 4am Eastern Time (5pm SGT) on nothing, with prices subsequently falling down quickly shortly after the physical stock market opened at 10am Eastern (11pm SGT) once again on nothing. There were indeed major economic news released between European trading hours and US pre market hours such as Bank of England and European Central Bank official rate announcements, on the US front we have Initial Jobless Claims as well, but none of the price action seen coincided with the news releases even if we assume that the news had any bullish/bearish impact (hint: no they don’t as all the news were within expectations).
Hourly Chart
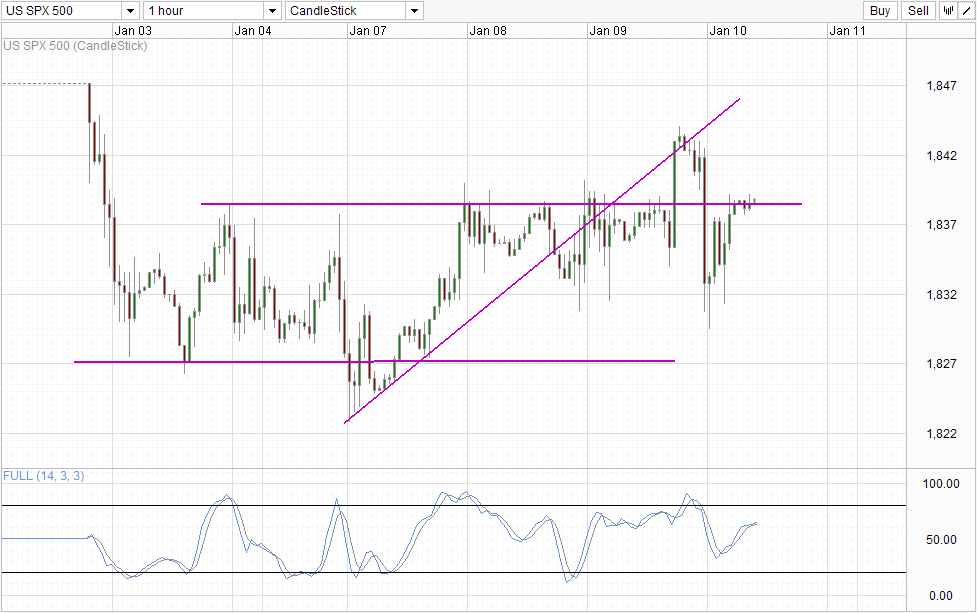
It seems that yesterday’s price action were simply a result of volatility. Seeing how the rally yesterday was capped by the rising trendline and the decline supported by 1,832 floor, the volatility explanation seems more plausible as price tend to respect trendlines more when it’s only moved by means of volatility and not fundamental directions.
If this assertion is correct, then the likelihood of prices being capped by current resistance band becomes higher. On the chart there is only 1 resistance level at 1,838, but realistically this ceiling is more of a band given that we’ve seen candlewicks peeking all the way to 1,840. However, it should be noted that prices did manage to break this aforementioned ceiling like butter on volatility alone, hence a break of 1,840 cannot be ruled out entirely. Stochastic readings is giving us mixed signals as well – on one hand both Stoch/Signal lines are pointing higher, indicating that a bullish cycle is still ongoing but on the other the distance between Stoch/Signal has narrowed significantly as we approach the “consolidation zone” between 60.0 – 75.0. Hence it will not be all too surprising if we start to see Stoch curve reversing lower in the immediate future as well.
Given all these, and knowing that volatility is strong, traders may wish to sit this one out until stronger directional signs are seen. Furthermore, tonight’s US Non-Farm Payroll will definitely create even more volatility, and we may need to wait until early next week to see if prices have made any significant breakthrough post NFP after dust has settled.
Weekly Chart
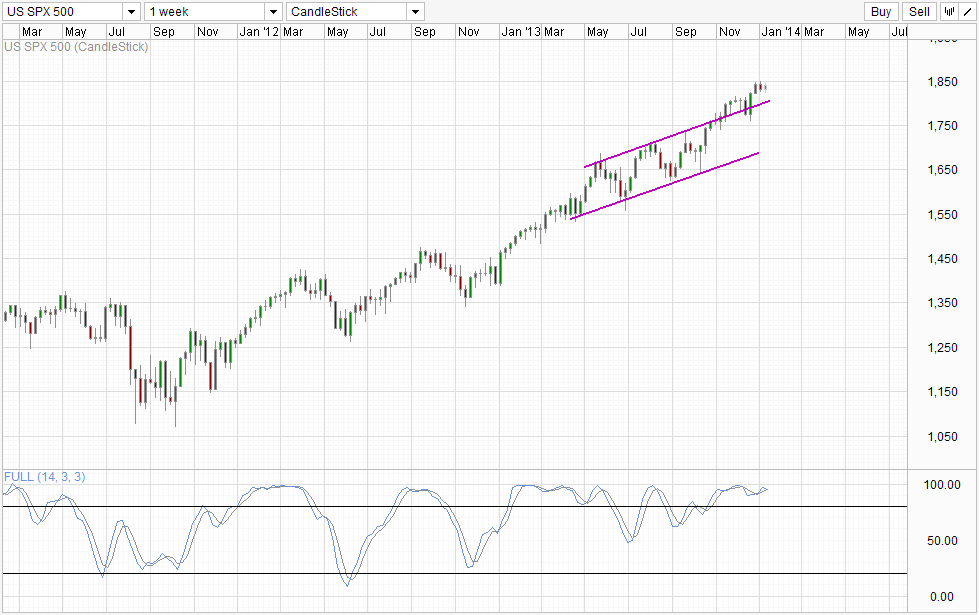
Nothing changed on Weekly Chart since current price levels is marginally higher than yesterday’s, and is barely noticeable on the Weekly. Nonetheless, we may be one week closer to see the long awaited pullback with Stoch curve looking likely to cross Signal line within the Overbought region. Nothing is confirmed though, especially since Stoch levels have been trending sideways between 90.0 – 100.0, and this bearish Stoch/Signal cross may turn out to be yet another dud.
More Links:
GBP/USD – Pound Steady As BOE Holds Course
AUD/USD – Aussie Steady After Mixed Australian Data
EUR/USD – Euro Edges Higher Ahead of ECB Statement
This article is for general information purposes only. It is not investment advice or a solution to buy or sell securities. Opinions are the authors; not necessarily that of OANDA Corporation or any of its affiliates, subsidiaries, officers or directors. Leveraged trading is high risk and not suitable for all. You could lose all of your deposited funds.

Mingze Wu
Latest posts by Mingze Wu (see all)
- European Bourses Not Enjoying Bullish Winds From US Stocks - 17 April 2014
- More Aggressive Stimulus Possible Despite Premier Li’s Denial - 17 April 2014
- China March FDI -1.5% Y/Y vs +2.05% expected. First decline in more than a year. - 16 April 2014