Cable pushed sharply lower yesterday despite glimpses of early bullishness. Prices rallied higher on the get-go and managed to hit a high of 1.6603, but that didn’t stop prices from tumbling heavily to a low of 1.641 before US noon. This decline was fuelled by a weaker than expected UK Manufacturing PMI, resulting in the break of 1.646 support which was the previous low of this week.
However, if we look at price action closely,. we would notice that the largest hourly decline did not occur when the PMI numbers were released but was more aggressive during early US hours, possibly led by risk off sentiment in line with the falling of S&P 500. Also, the decline actually started during late afternoon before European session started with resistance turned support around 1.678 already broken before the announcement. Furthermore, manufacturing PMI numbers stood at a strong 57.3, which is by no means shabby even though it is below the 58.2 expectations. Even if this number is bearish, it should not have triggered a 150 pip decline.
Hourly Chart
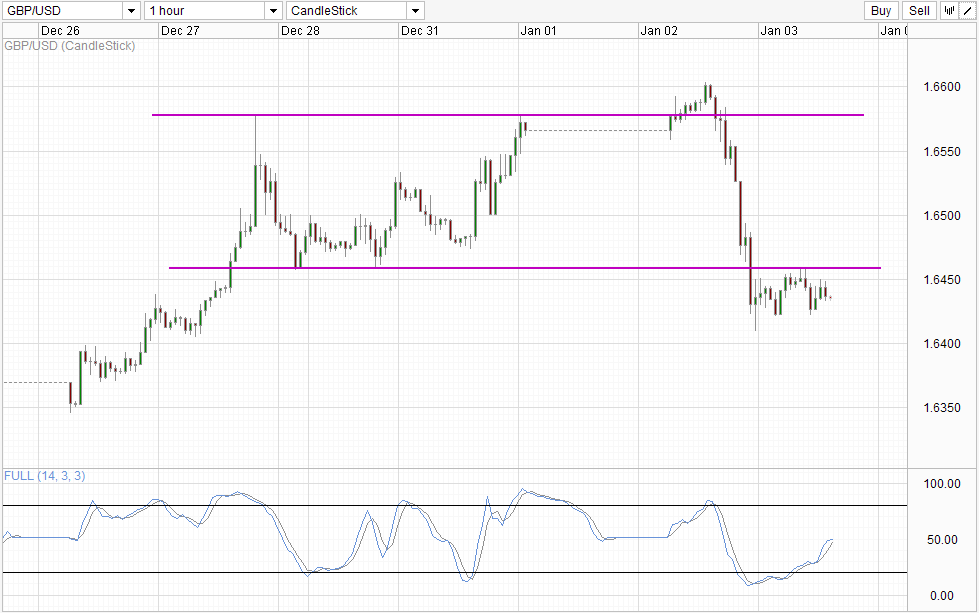
Does this mean that prices are currently bearish? Considering that AUD/USD and EUR/USD are moving erratically, traders can choose to file yesterday’s price action under the same “irrational volatility” folder given that market volume may not have been fully restored. Also even though the inability to trade back above 1.646 should be chalked as a bearish confirmation, bears have not managed to claw back all the gains won since Christmas, and even if we trade all the way to 1.635, all these can simply be regarded as the market correcting lower after bulls overextended themselves. Hence it will be premature to claim that GBP/USD has now turned bearish and we will definitely need further confirmation for proper bearish conviction.
Daily Chart
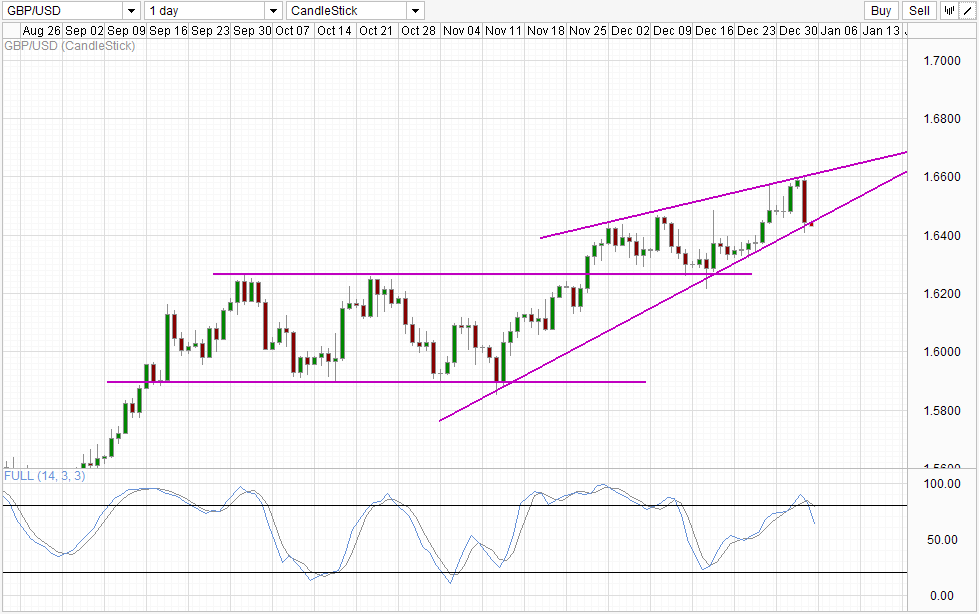
Daily Chart shows that price is on the verge of breaking away from the lower wedge, with Stochastic indicator showing a fresh bearish signal. If this is correct, we could see a bearish push that could potentially bring us to 1.626 at the minimum. But before we get too excited, it should be noted that the wedge drawn here is not “clean” with sketchy touch points. Hence, we will need clearer confirmation that price has broken away from the trendline, echoing the need for further confirmation in the short-term chart.
More Links:
S&P 500 – Hangover from New Year as Price Decline On Profit Taking
USD/JPY – Rangebound to Start New Year
This article is for general information purposes only. It is not investment advice or a solution to buy or sell securities. Opinions are the authors; not necessarily that of OANDA Corporation or any of its affiliates, subsidiaries, officers or directors. Leveraged trading is high risk and not suitable for all. You could lose all of your deposited funds.

Mingze Wu
Latest posts by Mingze Wu (see all)
- European Bourses Not Enjoying Bullish Winds From US Stocks - 17 April 2014
- More Aggressive Stimulus Possible Despite Premier Li’s Denial - 17 April 2014
- China March FDI -1.5% Y/Y vs +2.05% expected. First decline in more than a year. - 16 April 2014