Hourly Chart
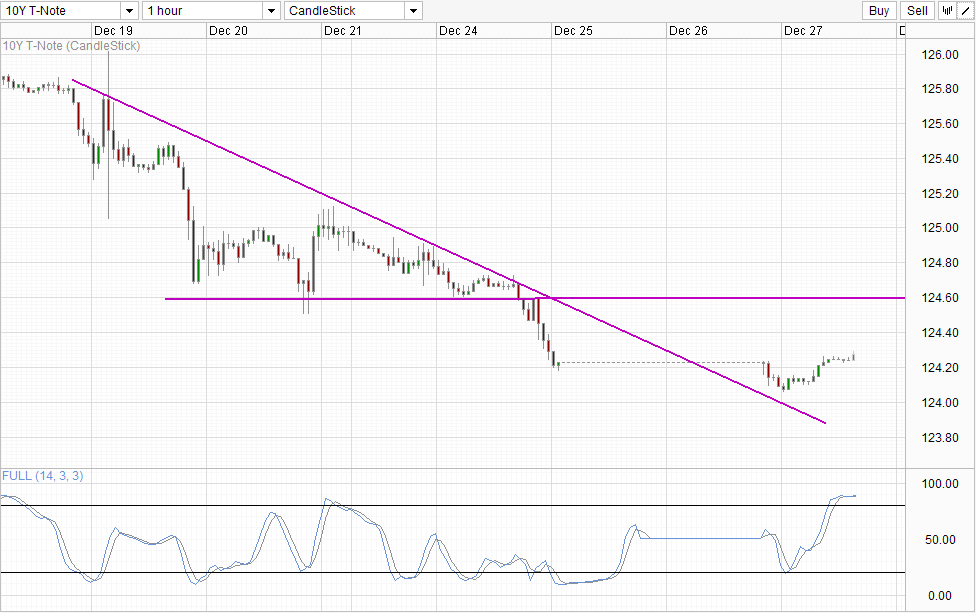
10Y Treasury Note briefly touched 3% yesterday but closed back below the line in the sand by the end of the trading session. Was hitting 3% a big surprise? Not really as bond prices have been falling steadily ever since Fed announced the QE tapering decision last week, hence it was a matter of time before the 3% level is breached. What about the pullback? It is also not surprising to see that prices have pushed back higher as it was expected that many buy orders were lined up at the 3% level to defend it. What is most surprising is how mild the rebound was. The physical 10Y T-Note closed at 2.98%, while Futures (the charts above and below) prices simply pushed back up gently. We’ve seen much stronger bullish pullback last week en-route to the 3% mark and it is interesting that bullish reply was this meek, implying that a retest of the 3% mark will be likely and we may even see the line in the sand being crossed today.
What does this mean for Futures prices? Well, implied yield on Futures was long above the 3% mark, but should the underlying 10Y T-Note cross the 3% level, we can expect a strong bearish breakout in bond prices which will definitely drag Futures lower as well.
Technicals support this notion as well, with the recent rebound already heavily Overbought when we are far from hitting the nearest resistance of 124.6. This suggest that a move back towards 124.6 may be out of reach right now, favouring a move towards 124.0
Weekly Chart
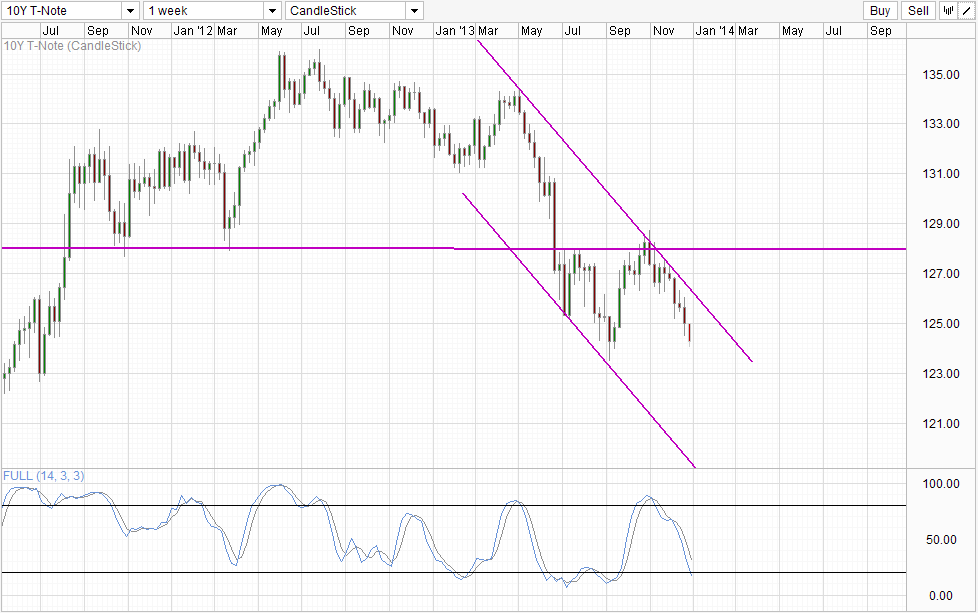
As a side note, it should be noted that this is not the first time the physical 10Y T-Note has tagged 3%, with the previous occurrence back in September 2013. However, Futures prices were much lower compared to now, suggesting that Futures still have room to head lower even though Stochastic readings show that we are already “oversold”. Ultimate bearish target for now will be Channel Bottom, but it is unlikely that we will be able to reach there based on this push alone. 123.0 round figure and 2011 July swing low appears to be a much more reasonable target for now, and even then we will need to see physical clearing 3% and rising significantly in order to hit it.
Fundamentally, with QE’s monthly Treasury purchases already cut by $5 billion (the other $5 billion cut is in mortgage bonds) and more to come in 2014, we can expect 10Y yields to move significantly higher than 3%. However, US Debt Ceiling and potential default crisis will come into play in Feb 2014 once again, and that may slow down Treasury prices descent. Considering that proper trading volume will only return somewhere in mid Jan, a Feb major event risk actually renders it rather pointless for traders to enter right now, and conservative traders may wish to actually wait for further development after Q1 2014 before entering.
More Links:
USD/JPY – New Highs (yet again) But Bullish Conviction Low
EUR/USD Technicals – S/T Bears Banished But It’s No Bullish Wonderland
Gold Technicals – Stable above 1,200
This article is for general information purposes only. It is not investment advice or a solution to buy or sell securities. Opinions are the authors; not necessarily that of OANDA Corporation or any of its affiliates, subsidiaries, officers or directors. Leveraged trading is high risk and not suitable for all. You could lose all of your deposited funds.

Mingze Wu
Latest posts by Mingze Wu (see all)
- European Bourses Not Enjoying Bullish Winds From US Stocks - 17 April 2014
- More Aggressive Stimulus Possible Despite Premier Li’s Denial - 17 April 2014
- China March FDI -1.5% Y/Y vs +2.05% expected. First decline in more than a year. - 16 April 2014