Weekly Chart
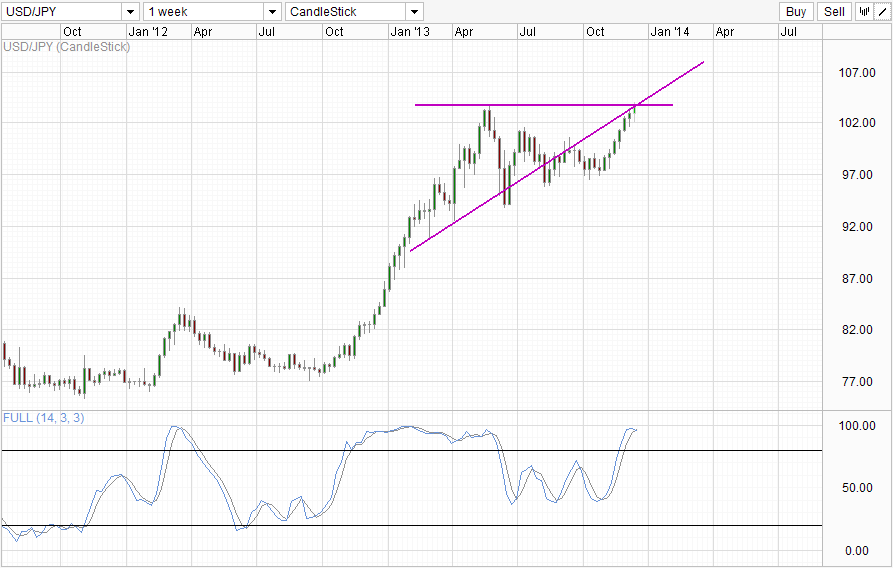
USD/JPY climbed sharply yesterday, following gains in USD led by risk off appetite during the US session. What is interesting is that safe haven flow did not enter into JPY, allowing USD/JPY to rally without much resistance when another safe currency CHF saw so much inflows that the currency was the biggest gainer D/D. It seems that market does see USD/JPY higher, which would imply that prices are currently in a good position for strong bullish follow through if we break above the 103.75 resistance and rising trendline confluence.
However, traders should seek further confirmation of the break as Stochastic readings favors a bearish reversal moving forward as Stoch curve is deep within Overbought region and is starting to head lower. This does not invalidate the possibility of further bullish venture as cyclical indicators such as Stochastic tend not to perform well during strong trends, but certainly traders should be cautious as current bullish momentum has been pushing for 6 consecutive week and looks likely to close out this week with a 7th – an incredible sequence that is rarely met historically. We did see a stronger and longer stretch back in late 2012 – early 2013, but that was spurred on by the history making BOJ stimulus package that was touted by Shinzo Abe back then. Currently market is expecting additional stimulus package from BOJ, but there is no way that this add on (if any) will be able to match the original package in terms of magnitude. Hence, the likelihood of significant pullback is real and bullish traders need to be extra careful moving forward.
Hourly Chart
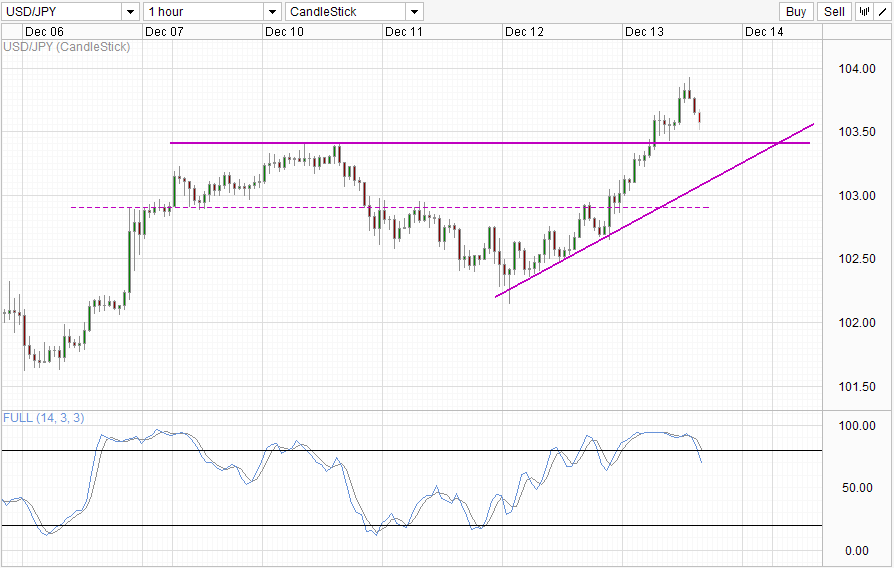
Things are not looking so hot for the bulls on the short-term chart either. Prices managed to break 103.4 and subsequently pushed up to a fresh 2013 high just a couple of hours ago after early declines managed to stay above 103.4 – confirming the bullish rally. However, hitting the fresh highs have not triggered stronger bullish response, but instead prices pulled lower, currently standing around the initial breakout levels. This does not invalidates the breakout, but certainly bullish impetus isn’t as strong as we’ve hoped, suggesting that short-term bullish traders may be satisfied after tagging the previous 2013 highs and is starting to close out their positions. Stochastic agrees, with readings currently giving a bearish cycle signal that may be able to bring us back to 103.4 and potentially all the way to the rising trendline.
More Links:
Gold Technicals – Finding Support Above 1,225
NZD/USD – Bearish Sentiment Trump Bullish Economic Fundamentals
EUR/USD – Resistance Level at 1.38 Stands Tall
This article is for general information purposes only. It is not investment advice or a solution to buy or sell securities. Opinions are the authors; not necessarily that of OANDA Corporation or any of its affiliates, subsidiaries, officers or directors. Leveraged trading is high risk and not suitable for all. You could lose all of your deposited funds.

Mingze Wu
Latest posts by Mingze Wu (see all)
- European Bourses Not Enjoying Bullish Winds From US Stocks - 17 April 2014
- More Aggressive Stimulus Possible Despite Premier Li’s Denial - 17 April 2014
- China March FDI -1.5% Y/Y vs +2.05% expected. First decline in more than a year. - 16 April 2014