Hourly Chart
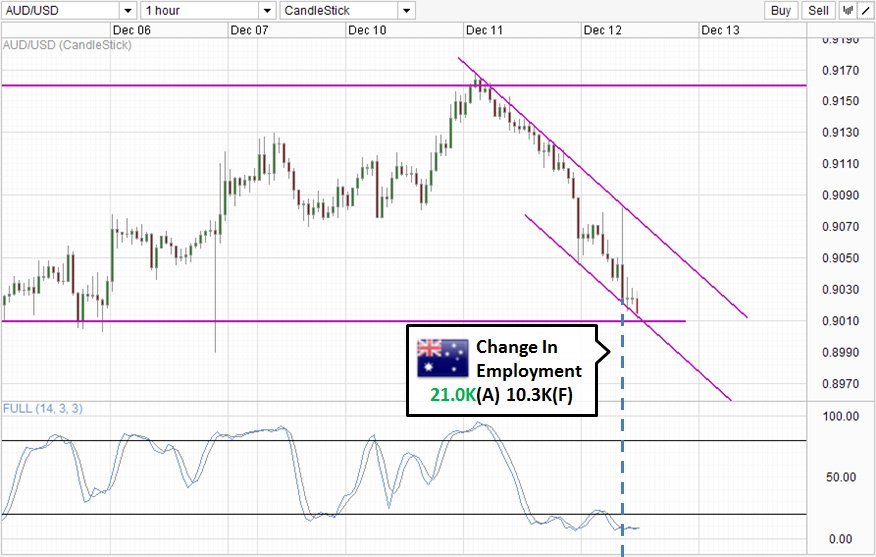
The strongest M/M Employment Change in 6 months failed to lift AUD/USD, with prices moving lower after the initial bullish push when the better than expected numbers were announced. AUD/USD rallied to a high of 0.9082 from 0.9063 pre announcement level. It is interesting to see a less than 20 pip rally when the headline number was more than double that of expected. Furthermore, this is not a case where the headline number is misleading; both Full Time and Part Time Employment gained, with Full Time Employment growing by 15.5K, a good reversal of the lost of 31.1k full time jobs in October. Gain in part time jobs fell from October’s 30.4K to a mere 5.5K, but more people are getting employed, so that is not really a cause of concern. Furthermore, participation rate stayed stable at 64.8%, so it is not as though that more people are suddenly entering the labor force which resulted in the increase of number of people employed.
The only mildly bearish number that can be found would be unemployment rate that has risen from 5.7% previous to current 5.8%. But that is already expected by analysts, and hence the sharp decline that followed is a reflection of the strong underlying bearish sentiment that is plaguing AUD/USD right now.
Technical pressures most likely contributed too, with early bulls unable to break the descending trendline that has been in play since last week’s high, adding on bearish momentum that resulted in a more than 50 pip decline (peak to trough) in the 30 mins that followed the announcement. This assertion is supported by the observation that the bullish rebound manage to form a nice descending channel with the trendline above, suggesting that the bearish move may have been slightly exaggerated by technical bears. This would increase the likelihood of prices rebounding off the intersection of 0.901 support and descending Channel Bottom, opening up a S/T move towards 0.905 and confluence with Channel Top. Stochastic readings agree, with Stoch curve deep within oversold region; favoring a bullish rebound moving forward.
Daily Chart
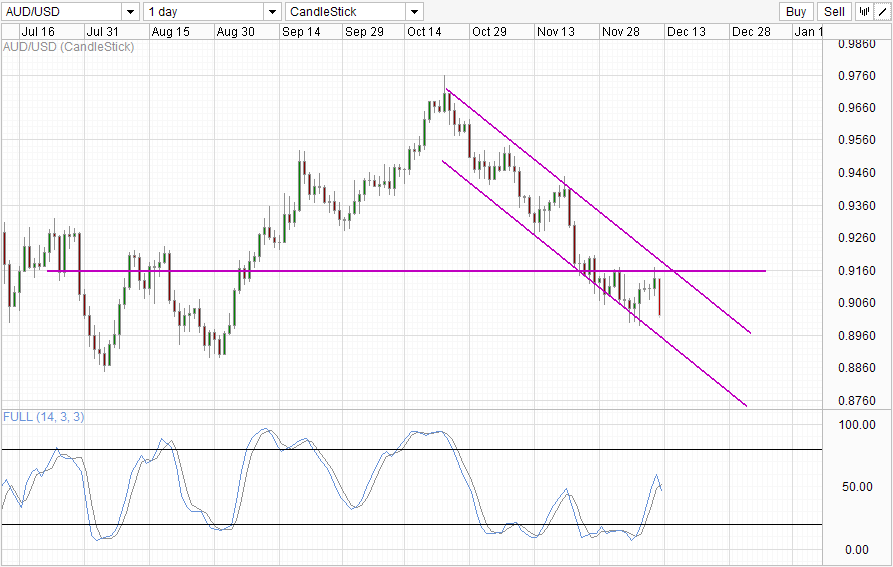
Daily Chart is bearish though, with prices rebounding off the 0.916 resistance. Prices did not manage to tag Channel Top as well, underlining the immense bearish pressure that AUD/USD is under in the longer term. Stochastic also agree with a Stoch peak already formed – suggesting that a bearish cycle is ongoing right now. Channel Bottom would be the obvious candidate for bearish objective, and it is possible that a rebound will happen around between 0.886 which incidentally is the 2013 low and most likely confluence with Channel Bottom if price reach there on current pace of decline. Also, Stochastic readings will likely be Oversold when this happen, strengthening the scenario which implies that a new 2013 low will not be forged in the near term.
More Links:
NZD/USD – Higher On RBNZ Guidance But No Home Run For Bulls
GBP/USD – Falls Sharply From Resistance Level at 1.6450
EUR/USD – Eases Back from Resistance Level at 1.38
This article is for general information purposes only. It is not investment advice or a solution to buy or sell securities. Opinions are the authors; not necessarily that of OANDA Corporation or any of its affiliates, subsidiaries, officers or directors. Leveraged trading is high risk and not suitable for all. You could lose all of your deposited funds.

Mingze Wu
Latest posts by Mingze Wu (see all)
- European Bourses Not Enjoying Bullish Winds From US Stocks - 17 April 2014
- More Aggressive Stimulus Possible Despite Premier Li’s Denial - 17 April 2014
- China March FDI -1.5% Y/Y vs +2.05% expected. First decline in more than a year. - 16 April 2014