4 Hourly Chart
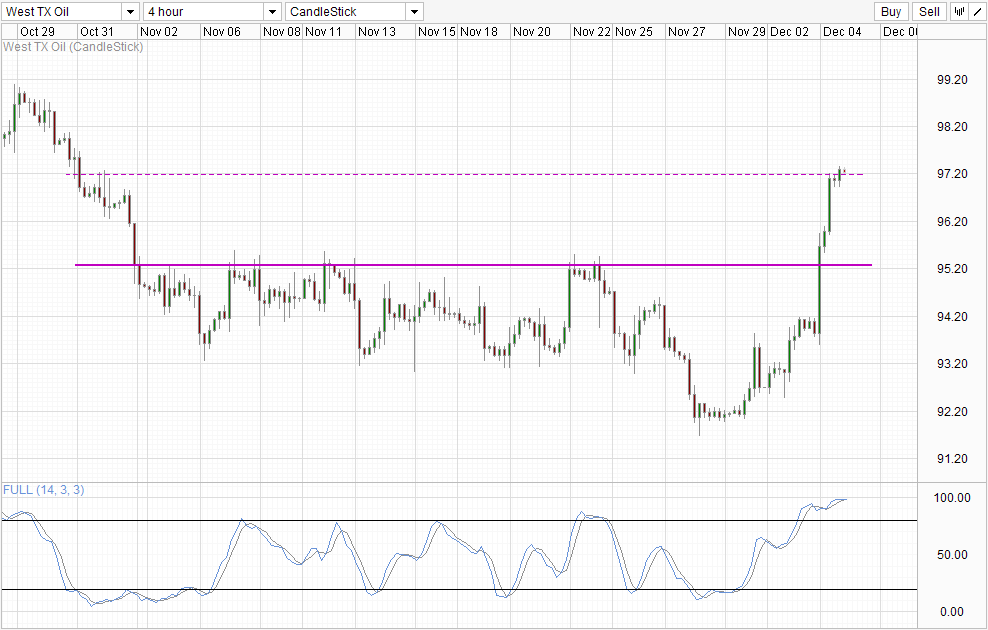
Crude Oil prices advanced once again yesterday, with futures prices gaining 1.4% by the end of New York session. This increase was brought about by news from TransCanada Corp which said that it will start part of its Keystone XL pipeline next month – which will alleviate the supply glut issue by shipping a larger quantity of the overflowing crude oil inventories in US. This is not the first time announcement related to the Keystone pipeline has brought about tremendous gains in 2013 – we have similar occurrences back in Q1 and Q3 2013 where announcement about the completion of Keystone pipeline brought short-term great gains, only to see WTI prices climbing back down again in subsequent weeks.
Hence, it is unlikely that current rally will sustain long enough to bring prices back above the century line this time round, especially since the whole Keystone project was already planned years in advanced with projected completion and operational dates already made known earlier. Yesterday’s bullish reaction is not an indication of the benefits that Keystone pipeline will bring, but rather an overreaction from bulls that have been under heavy pressure since late August.
Daily Chart
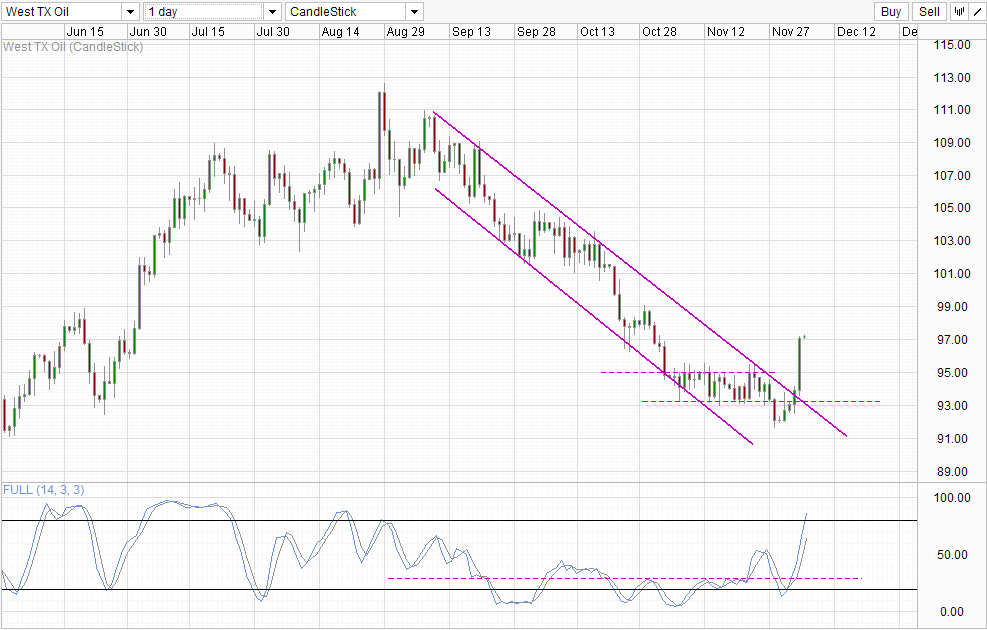
Looking at the Daily Chart, we can see that there hasn’t been any significant pullback in the past 3 months, which explains the strong bullish reaction yesterday as it also coincided with the break of descending Channel Top, resulting in a strong bullish breakout. However, prices is now right smack within the 97-99.0 consolidation zone which will be providing resistance, while Stochastic readings is also within the Overbought region – favoring a pullback moving forward. This is in line with the fundamental analysis which believe that bullish follow-through will be found wanting.
Nonetheless, there are some bullish signs right now. Latest inventory data from American Petroleum Institute shows massive 12.4 million decrease in Crude Oil inventory, which contributed to yesterday’s rally as well. This number has stumped analysts who were only expecting a fall of around 1+ million barrels, with many market watchers believing that there may have been a misstatement. With US Energy Information Administration releasing the official numbers later today, we may have a better indication of the validity of the inventory numbers.
If the EIA numbers show similar stupendous decline in inventory levels, WTI prices will certainly rise today but breaching the 99.0 ceiling may still prove to be a challenge given the global economic slowdown especially in developing countries (India, China, South East Asia) which accounts for the majority of Global manufacturing and production. On the other hand, if EIA numbers come in less than 12 million, current bull run may be cut short, and we could see a quick reversion of prices pushing back towards Channel Top once more.
More Links:
Gold Technicals – Stable Despite Additional QE Taper Fears
GBP/USD – Bounces off Support at 1.6350
S&P 500 – Bearish Acceleration Seen below 1,800
This article is for general information purposes only. It is not investment advice or a solution to buy or sell securities. Opinions are the authors; not necessarily that of OANDA Corporation or any of its affiliates, subsidiaries, officers or directors. Leveraged trading is high risk and not suitable for all. You could lose all of your deposited funds.

Mingze Wu
Latest posts by Mingze Wu (see all)
- European Bourses Not Enjoying Bullish Winds From US Stocks - 17 April 2014
- More Aggressive Stimulus Possible Despite Premier Li’s Denial - 17 April 2014
- China March FDI -1.5% Y/Y vs +2.05% expected. First decline in more than a year. - 16 April 2014