Hourly Chart
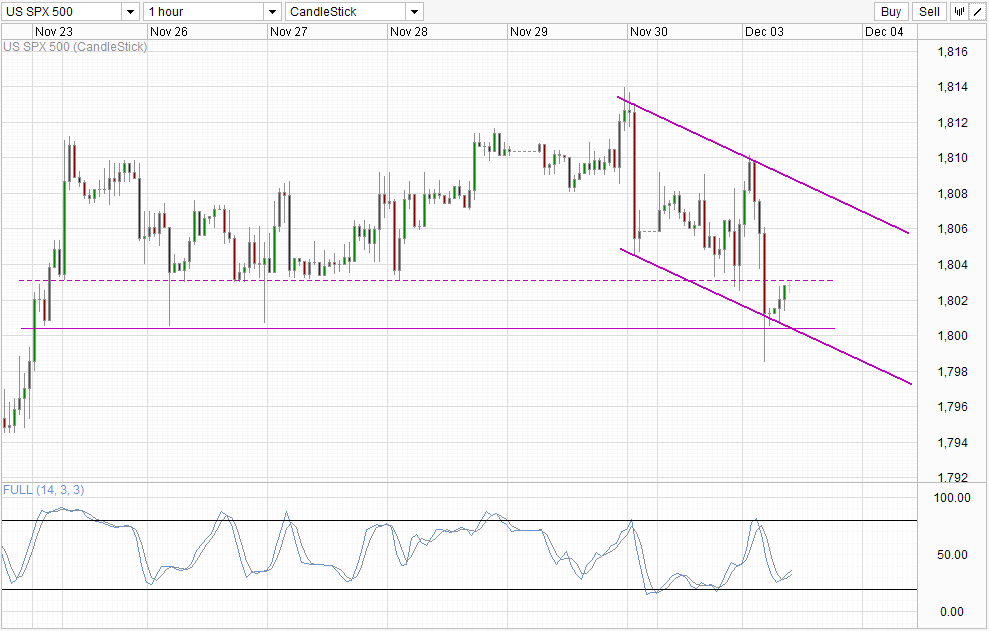
S&P 500 started off December in the red, with the physical stock index losing 4.91 points (0.27%) and marking the second time in 2 trading days where losses in the final few trading hours erased earlier gains and then some. This sell off is rather inexplicable, as there wasn’t any news announcement made when the sell off started. Furthermore, technicals does not be give us a good explanation either, as the Channel that is in play is drawn AFTER the sell-off and the subsequent rebound. Hence, it is difficult to make the assertion that prices actually pushed lower due to influence from Channel Top.
It is even more interesting when we consider that market was mostly bullish – we had stronger than expected Manufacturing PMI numbers from China, while US ISM Manufacturing for the month of November came in strong at 57.3 vs 55.1 expected. One could argue that the stronger economic numbers provide yet more reasons for speculators to believe that a Fed Taper is incoming, but S&P 500 prices actually pushed up higher when the ISM numbers were released, making short work of this theory.
Perhaps, a good explanation is that prices are simply directionless, a hallmark of December seasonality which is sprinkled with large swings in between. This suggestion makes sense especially given the backdrop of Taper/No Taper guessing game. What this imply is that prices may continue staying sideways ahead of FOMC meeting in 2 weeks time, and traders should be aware that likelihood of pullbacks in either direction is high.
This would mean that the likelihood of prices pushing higher towards Channel Top (and perhaps beyond) is high, a notion that is supported by technicals with prices finding support from the support band between 1,800 – 1,803. Stochastic indicator agrees with Stoch curve rebounding off the “support” level of 30.0 favoring a bullish cycle moving forward. However, prices should ideally break 1,803 before bullish conviction can take hold, as the risk of prices staying between 1,800 – 1,803 remains.
Weekly Chart
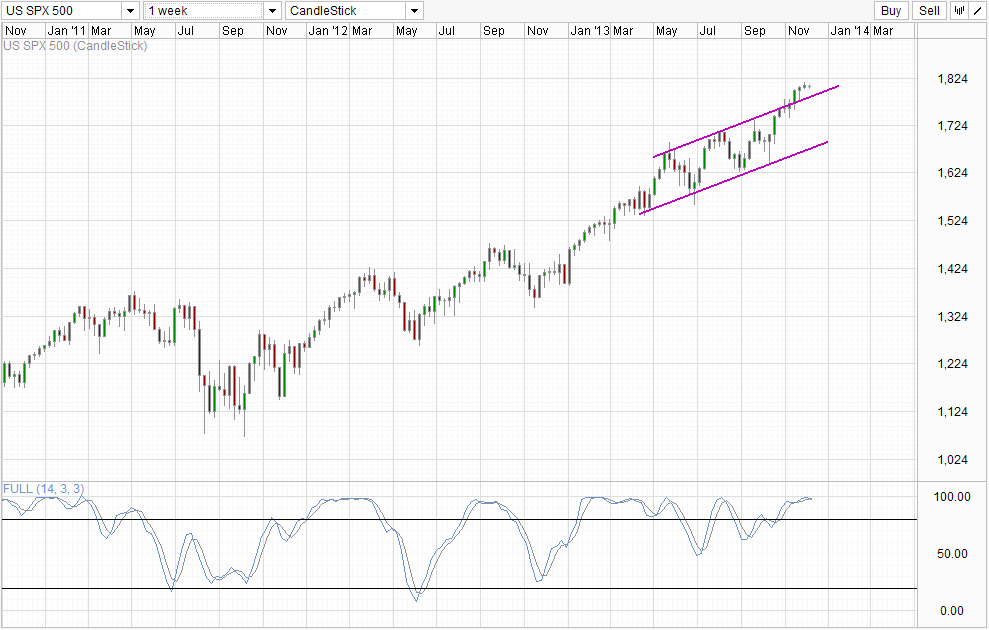
Weekly Chart tells us similar story from the Hourly – Bullish momentum has slowed down considerably and it seems that the breakout of Channel Top has not achieved much, which opens up a move towards Channel Top once again. However, there isn’t any evidence of a full bearish reversal, and the likelihood of prices rebounding off Channel Top remains high. This is in line with the sideways outlook from the Hourly (at least for the next week until FOMC December).
More Links:
AUD/USD – Turns Around and Looks Towards 0.90 Again
EUR/USD – Falls back to Key Level at 1.3550
GBP/USD – Eases Away from Two Year High towards 1.6350
This article is for general information purposes only. It is not investment advice or a solution to buy or sell securities. Opinions are the authors; not necessarily that of OANDA Corporation or any of its affiliates, subsidiaries, officers or directors. Leveraged trading is high risk and not suitable for all. You could lose all of your deposited funds.

Mingze Wu
Latest posts by Mingze Wu (see all)
- European Bourses Not Enjoying Bullish Winds From US Stocks - 17 April 2014
- More Aggressive Stimulus Possible Despite Premier Li’s Denial - 17 April 2014
- China March FDI -1.5% Y/Y vs +2.05% expected. First decline in more than a year. - 16 April 2014