US Crude Oil Futures fell to a 5 month low yesterday on oversupply concerns. Polls released yesterday showed that analysts believe that crude inventories will gain by an average of 1.8 million barrels for the week ending in 1st November, potentially extending the oversupply trend to a 7th consecutive week.
Even though a 7-weeks streak is not the longest that we’ve seen in recent years, the magnitude of the inventory buildup will be one of the most aggressive. Current longest buildup streak in 2013 belongs to the Mar – May period where we’ve seen 8 weeks of consecutive buildup for an average of close to 3 million barrels a week. While the longest streak in the past 3 years belong to last year’s 10 weeks buildup back in April – June, where prices fell from 105.0 to below 78.0 when the bearish move is over. The total increase in inventory during the period was 38.4 million barrels, amounting to almost 4 million barrels a week.
What about current streak? 4.7 million barrels each week, for a total of 28.2 million barrels.
This volume is 20 percent more than what the 8 week streak contributed this year, which also explains why prices have already declined almost 20 dollars a barrel from peak to trough in current move, versus the meek decline of less than 10 dollars a barrel between Feb – April where the 8 streak was observed. Considering that price fell more than 30 dollars a barrel when the 10 week streak of 2012 was observed, the potential for price to fall more another $10 or more is high if we see another 3-4 consecutive weeks of inventory buildup.
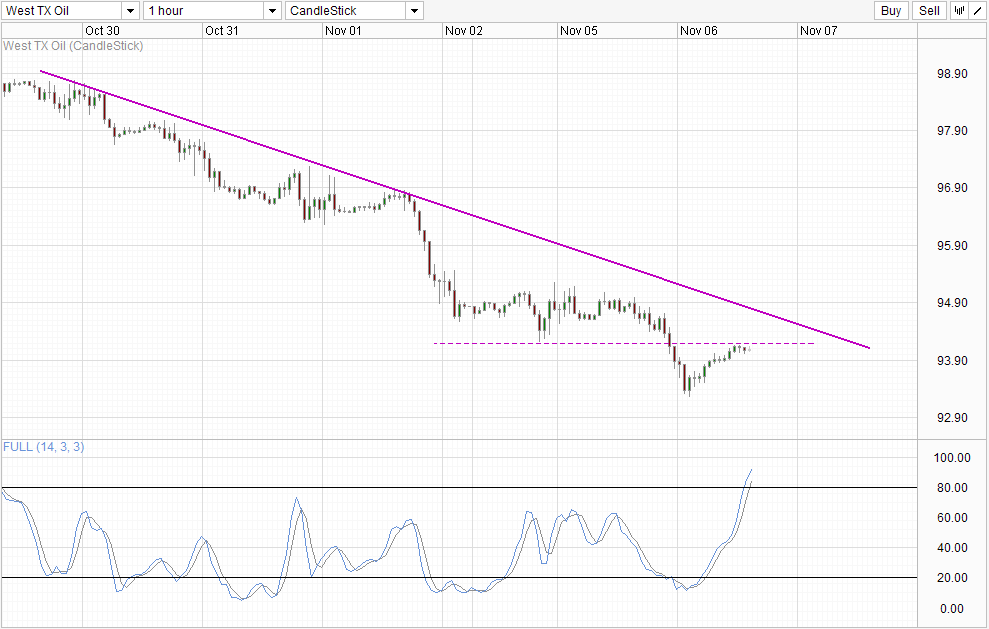
Hourly Chart
However, early signs are not optimistic. Yesterday’s inventory numbers from the privately funded American Petroleum Institute reflected a gain of only 0.87 million barrels. Almost a million short of the consensus estimate. Generally API numbers tend to understate the changes versus the official numbers released by the Department of Energy which will be released later today, but last week’s DOE numbers actually trailed API figures, hence the risk of the same happening should not be ignored.
Prices has already rallied significantly following the release of API numbers, and should DOE numbers surprise to the upside, we could potentially see prices breaking above the 94.2 resistance and potentially even push all the way up towards the 95.0 ceiling of the earlier consolidation zone. Failure to do so would be a key confirmation that sentiment remains heavily bearish and increase the likelihood of a new low for 2013. Even if prices manage to hit 95.0, the likelihood of a bearish reversal is high as well as Stochastic readings suggest that bullish momentum is already Overbought as it is. However, by pushing towards 95.0, bulls would have broken the descending trendline which will help to provide support and slowing bearish momentum down in the near term.
Weekly Chart
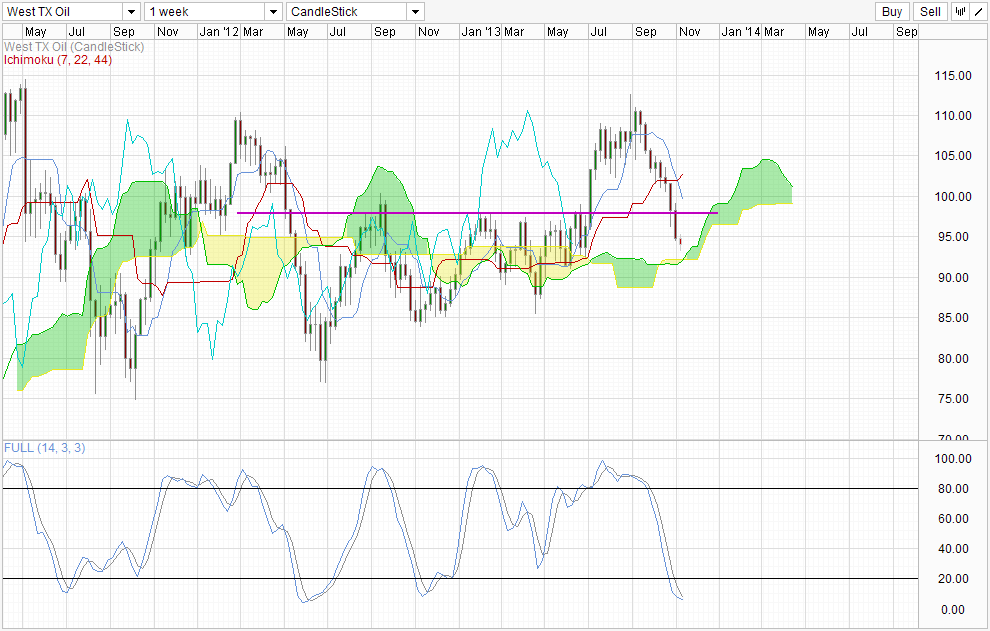
Weekly Chart remains heavily bearish, with low 80s as potential bearish objectives. However, a temporary pullback may occur within the next few weeks. Firstly, Stochastic readings suggest that we are heavily Oversold, and the pace of bearish momentum has slowed down significantly with Stoch curve tapering flat and converging towards the Signal line – looking likely to form a trough soon. Price is also heading towards the Ichimoku indicator’s Kumo beneath, which is expected to provide some support and potentially trigger a move back towards the 98.0 ceiling. Lastly, should this week’s candle closes where we are right now, we will have a 5 consecutive weekly loss, a streak that is only matched twice since 1998.
Considering that we have not seen any significant pullback since the onset of current bearish run, we are certainly way overdue for one, and traders who have yet join in this decline may find it rather risky to chase the trend right now even if a bearish confirmation from DOE occurs later today.
More Links:
Gold Technicals – Between 1,306 and 1,322 After Failed Bearish Push
USD/JPY Technicals – Slightly Bearish Amidst Still Water
NZD/USD – Post Job Data Rally Lacking Punch
This article is for general information purposes only. It is not investment advice or a solution to buy or sell securities. Opinions are the authors; not necessarily that of OANDA Corporation or any of its affiliates, subsidiaries, officers or directors. Leveraged trading is high risk and not suitable for all. You could lose all of your deposited funds.

Mingze Wu
Latest posts by Mingze Wu (see all)
- European Bourses Not Enjoying Bullish Winds From US Stocks - 17 April 2014
- More Aggressive Stimulus Possible Despite Premier Li’s Denial - 17 April 2014
- China March FDI -1.5% Y/Y vs +2.05% expected. First decline in more than a year. - 16 April 2014