US Stocks enjoyed modest gain on Monday, with S&P 500 climbing 0.36% and Dow 30 by 0.15%. This stronger risk appetite drove yields higher – bond prices lower as demand for safety assets decreased. On a separate note, yesterday’s traditional correlation is a good sign that the stock gains are based on proper bullish sentiment and not due to speculation that QE stimulus will last longer, as that would have driven Treasuries prices higher. Nonetheless, it is strange that market was actually bullish considering economic news release during US session yesterday was actually bearish with Factory Orders for both September and August were both lower than expected.
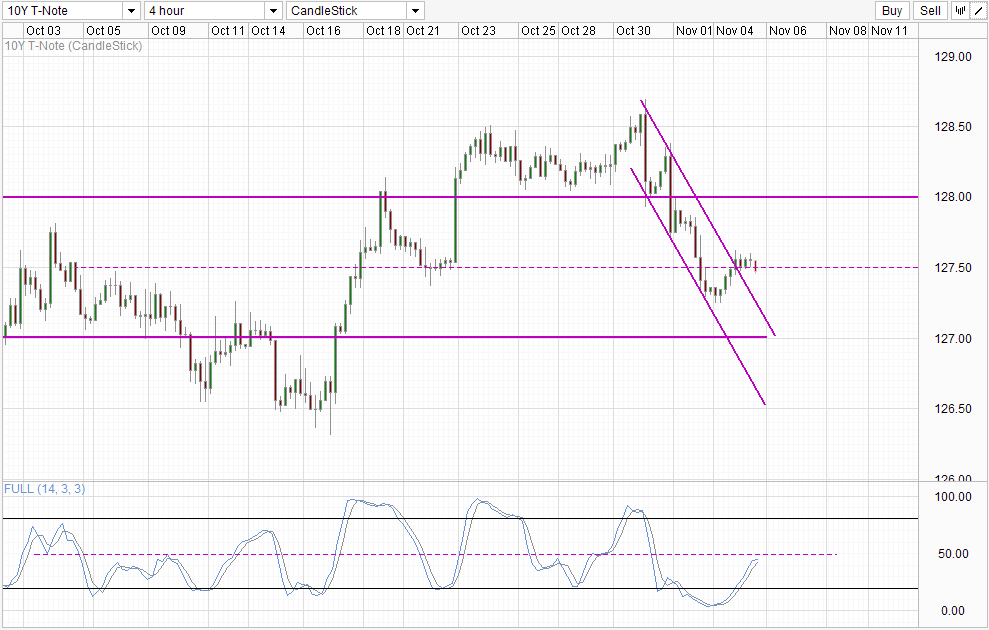
4 Hourly Chart
Perhaps market may be focusing more on the New York ISM numbers which came in at 59.3, much higher than September’s 53.6. Or perhaps market is more forgiving about the miss in Factory Orders as September’s numbers are still relatively positive at 1.7%, just missing the analysts consensus estimate by 0.1% and a huge improvement from July’s and August’s prints of -2.4% and -0.1% respectively.
For what it’s worth, this bullish sentiment has sent prices below 127.50, in conjunction with Stochastic readings facing “resistance” around the 50.0 level. This opens up the possibility of prices pushing towards 127.0 and Channel Top.
Weekly Chart
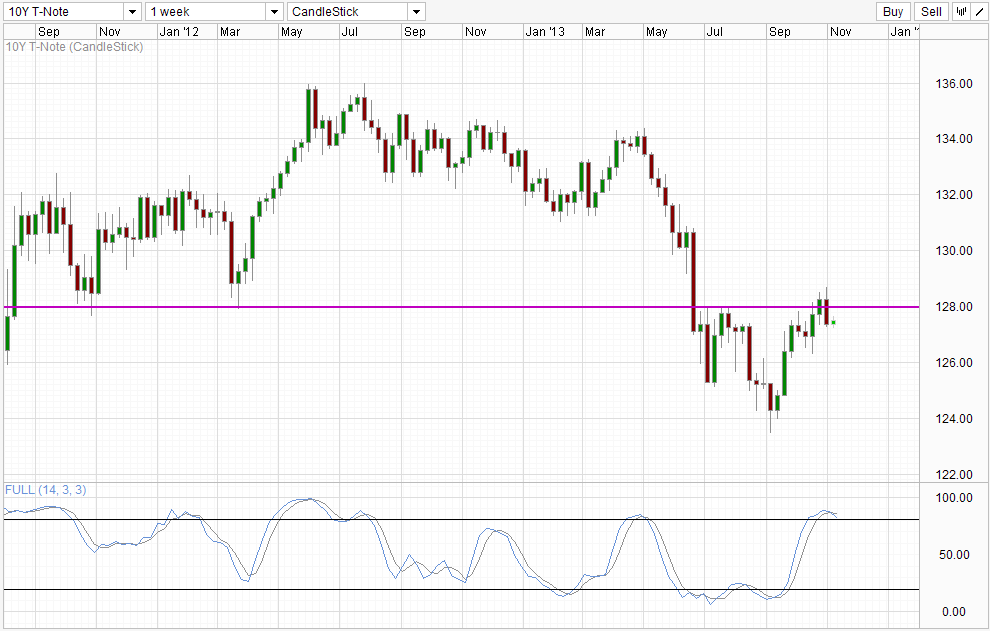
Weekly Chart is overall bearish but it is still interesting to see that prices is actually mildly bullish for this week’s candle thus far instead of heading lower sharply following the bearish rejection of 128.0 and the bearish engulfing candle that was formed the week prior. Hence, a push towards 128.0 is still possible especially since Stochastic has yet produce a proper bearish cycle signal. But if we end the week lower, the bearish weekly candle will add as a confirmation for the bearish reversal signal. It is also likely that Stochastic readings will push below 80.0 should that happen, adding one more bearish conviction for price to head towards 2013 low once again.
Fundamentally, with QE program expected to be reduced/cut within the next 12 months, demand for Treasuries are expected to fall eventually, and we could see 10Y implied yields finally breaking the 3.0% mark – which translates to price trading below 123.50 eventually. There may be short-term demand in the interim, probably from a proper resolution of the US debt ceiling and Government budget. But it is unlikely that this short-term jump in demand will push prices up too far considering that they will be comprised of institutions who have pulled out due to fear of default to begin with. This will not disrupt the bigger QE tapering narrative which will remain the main driver for bearish momentum.
More Links:
AUD/USD – RBA Hold Rates at 2.50%, Wants Weaker AUD
EUR/USD Technicals – 1.35 Support Band Holding
GBP/USD – Pound Gains Ground As Construction PMI Sparkles
This article is for general information purposes only. It is not investment advice or a solution to buy or sell securities. Opinions are the authors; not necessarily that of OANDA Corporation or any of its affiliates, subsidiaries, officers or directors. Leveraged trading is high risk and not suitable for all. You could lose all of your deposited funds.

Mingze Wu
Latest posts by Mingze Wu (see all)
- European Bourses Not Enjoying Bullish Winds From US Stocks - 17 April 2014
- More Aggressive Stimulus Possible Despite Premier Li’s Denial - 17 April 2014
- China March FDI -1.5% Y/Y vs +2.05% expected. First decline in more than a year. - 16 April 2014