US Stocks and Bonds sold off like hotcakes following a more hawkish than expected FOMC statement yesterday, sending prices of US10Y Notes below 128.0 for the first time since we’ve breached the level on 22nd October. Prices recovered within the hour and traded above 128.0 once again, but overall bias remain bearish, with early Asian session sending price close to the 128.0 level but not low enough to test it in any meaningful way, at least not yet.
It may be frustrating to see 128.0 round figure support continuing to hold firm even after the Fed have showed their cards. But it is important to remember that the latest FOMC statement did not really mention anything outright hawkish. To be fair, the Fed maintained QE purchase at $85 Billion monthly, and indicated that policy interest rate will be held at near zero record lows as long as unemployment rate stays above 6.5%. Market appears to be focusing more on what Fed didn’t say – namely the 16 day Government shutdown.
Most speculators believed that QE3 will continue for a longer while because of the negative economic impact the partial Government shutdown has brought, and expected this round of FOMC statement to at least mention something about it. Failure to do so suggest that Fed may still adhering to its undisclosed timeline, which means QE taper is still a potential go ahead in January if not December. Or at least that is how speculators are interpreting the latest FOMC statement.
Without any positive hawkish indication, we are basically speculating. Hence it should not be surprising to see 128.0 support holding especially given that market was trending sideways trading mostly between 128.0 – 128.5. Yesterday’s rally towards 128.7 can be regarded as a preemptive speculative move by market pricing in a more dovish than expected Fed, and the decline that brought prices back down to 128.0 thereabouts is simply a revaluation after the majority of speculators realized they’ve got it wrong.
Hourly Chart
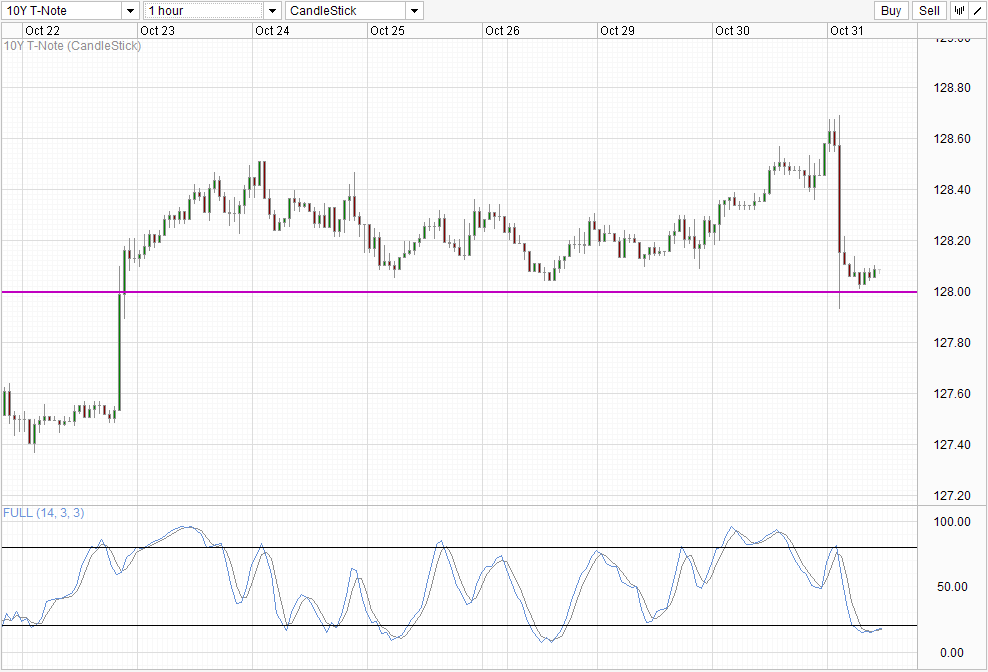
From a technical perspective, the likelihood of 128.0 holding is high as well. Stochastic readings show us that bearish momentum is Oversold and is due for a bullish pullback. Should price trade above 128.1 and coincide with Stoch curve pushing above 20.0, the possibility of price heading towards consolidation ceiling of 128.5 increases.
Weekly Chart
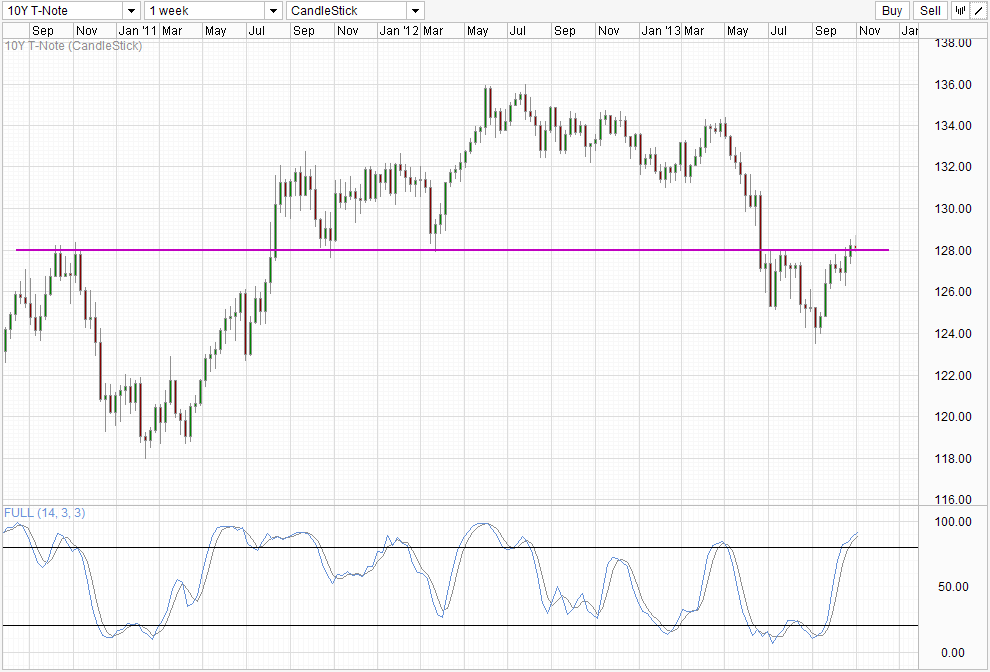
Weekly Chart is slightly bearish, and even though we are currently trading above 128.0, we are still in the midst of forming two thirds of an Evening Star bearish reversal pattern if price closes this week around current levels. Stochastic readings are heavily Overbought, and suggest that we could see a bearish cycle coming in the future. However, should prices trade above 128.4, the Doji/Shooting Star candle right now will no longer be valid and we must seriously consider the possibility of price pushing towards the next resistance level of 130.0. Overbought Stochastic does not necessarily negate further bullishness, as readings do have further space to climb.
More Links:
GBP/USD – Takes a Breather from Fall below 1.6050
AUD/USD – Trying to Hold on to Key Level of 0.95
EUR/USD – Finds Support at 1.37
This article is for general information purposes only. It is not investment advice or a solution to buy or sell securities. Opinions are the authors; not necessarily that of OANDA Corporation or any of its affiliates, subsidiaries, officers or directors. Leveraged trading is high risk and not suitable for all. You could lose all of your deposited funds.

Mingze Wu
Latest posts by Mingze Wu (see all)
- European Bourses Not Enjoying Bullish Winds From US Stocks - 17 April 2014
- More Aggressive Stimulus Possible Despite Premier Li’s Denial - 17 April 2014
- China March FDI -1.5% Y/Y vs +2.05% expected. First decline in more than a year. - 16 April 2014