The longest bearish streak in 2013 has been broken, with S&P 500 climbing 0.35% and Dow 30 doing marginally better at 0.36%. If you check the newswires today, it is likely that journalists and market watchers have attributed the gains to the better than expected Initial Jobless Claims. However, there were other news that were released – Core Personal Consumption fell to 0.6% from previous month’s 0.8%, and lower than what analyst expected. Overall Personal Consumption Headline is similarly lower than the expected 1.9%, but growth rates at least stayed constant from Q2. There’s more to come: US Q2 GDP (final) came in at 2.5%, matching the Prelim numbers but lower than 2.6% estimate. Finally, we wrapped up the major announcements with US Pending Home Sales that was below expectations on both Y/Y and M/M perspective. Perhaps more damning is the M/M numbers, showing a decline of 1.6%, suggesting that there could be a reversal in the Housing Market which shrinkage seen in the past 3 months. Hence certainly if a verdict has to be made about yesterday’s announcements, it would be undoubtedly bearish, unlike what major newswires are suggesting. In fact, we have additional cherry on the bearish cake with Kansas City Fed Manufacturing Activity falling to 2.
So why did stock prices actually rallied then? As it has been noted since the fateful FOMC announcement (or rather the lack thereof) last Wed, market is now reacting positively towards bearish news and vice versa. Hence a broad bearishness actually sent stock prices higher as it implies that Fed will be less likely to announce a QE taper cut in October.
S&P 500 Hourly Chart
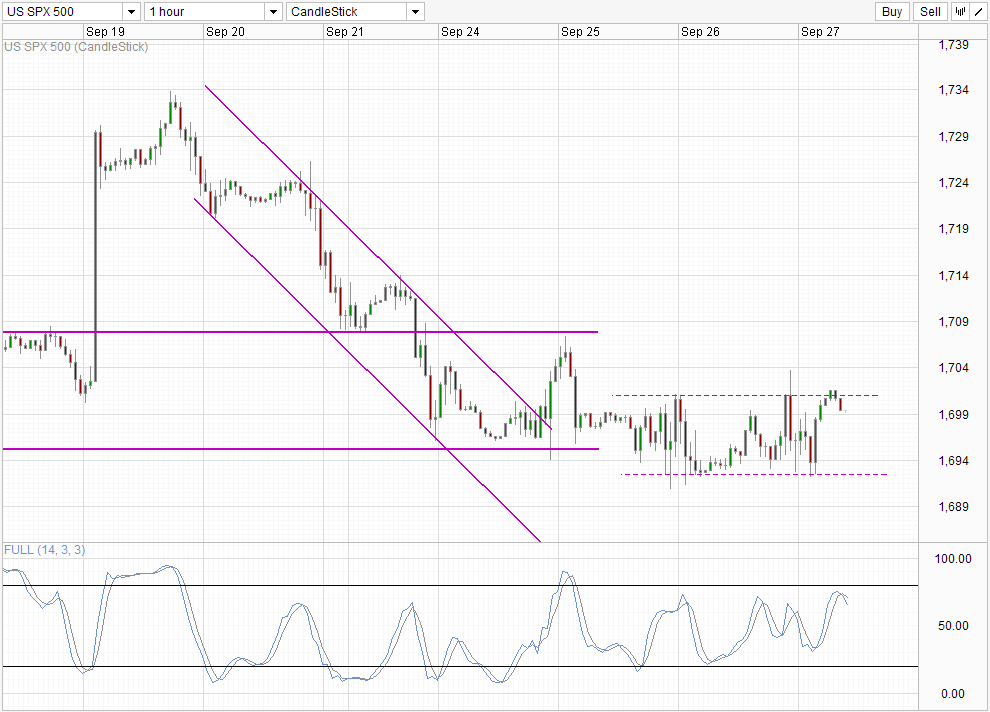
Despite all the kerfuffle surrounding fundamentals, it is interesting to see technicals continue to exert strong influence. The rally was capped by the soft resistance level of 1,702 and the resulting sell-off is also significant, but only managed to hold around the soft support of 1,692. Prices rebounded from there once again, but was stopped by 1,702 once again, giving us a very nice 10 points consolidation range with 1,692 now open as a bearish target. Stochastic readings agrees, with readings pointing lower and signalling a bearish cycle signal even though the turnaround did not occur within the Overbought region. However, with the past Stoch peaks around current levels, there is precedence that bear cycle signals around here can be reliable.
Dow 30 Hourly Chart
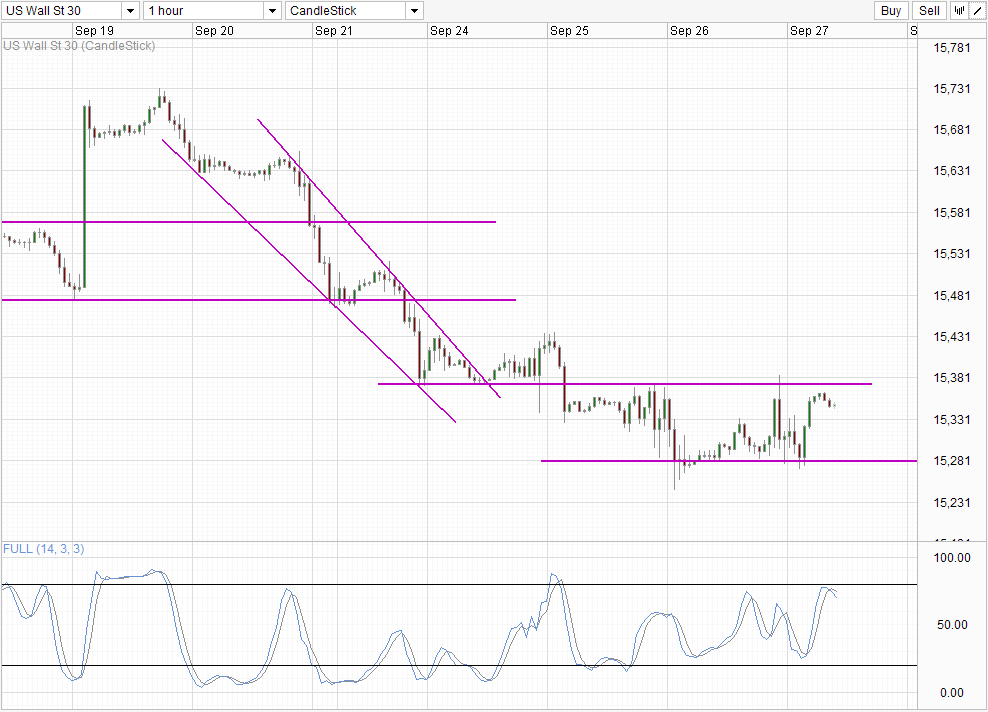
Dow 30 has also stabilized significantly, with short-term rallies now able to match the sell-offs in terms of magnitude. This is a positive change from the past 2-3 days where sell-offs in Dow 30 was much more bearish compared to S&P 500. This suggest that we could be trending sideways in the near term for both Dow 30 and S&P 500.
More Links:
NZD/USD Technicals – Staying Under 0.83
Rhyme And Reason Not A EURO Or Dollar Concern
Gold Technicals – Higher On US Budget Concerns
This article is for general information purposes only. It is not investment advice or a solution to buy or sell securities. Opinions are the authors; not necessarily that of OANDA Corporation or any of its affiliates, subsidiaries, officers or directors. Leveraged trading is high risk and not suitable for all. You could lose all of your deposited funds.

Mingze Wu
Latest posts by Mingze Wu (see all)
- European Bourses Not Enjoying Bullish Winds From US Stocks - 17 April 2014
- More Aggressive Stimulus Possible Despite Premier Li’s Denial - 17 April 2014
- China March FDI -1.5% Y/Y vs +2.05% expected. First decline in more than a year. - 16 April 2014