US Stocks extend losing streak, with S&p 500 falling lower by 0.27% and Dow 30 by 0.40%. Yesterday’s decline also gave S&P 500 the longest losing streak in 2013, but just as how the previous winning streak didn’t roar higher, this 5 day losing streak was not achieved with great slides, but with gentle nudges. Looking at peak/trough of S&P 500 Futures, the 5 day decline only amounted to less than 2.5%, and the losses on physical Stock is even lesser. This is highly insignificant since S&P 500 is capable of doling out daily movements of more than 1%, and we’ve seen daily declines of 2.5% isn’t that rare either. Hence do not automatically assume that this record bearish streak in 2013 will be able to lead to stronger bearish momentum in the near term.
In terms of reasons for decline, we do not have to look too far with stronger than expected economic numbers coming out from US yesterday. Durable Goods Orders grew 0.1% vs an expected -0.2% decline and a huge reversal from July’s -8.1%. However, the more important figure is actually New Home Sales which grew 7.9% M/M vs an expected 6.6%, also a tremendous u-turn from July’s -14.1%. The better than expected prints resulted in an increase speculation/fear that a QE Taper will come in October, driving Stock prices lower.
S&P 500 Hourly Chart
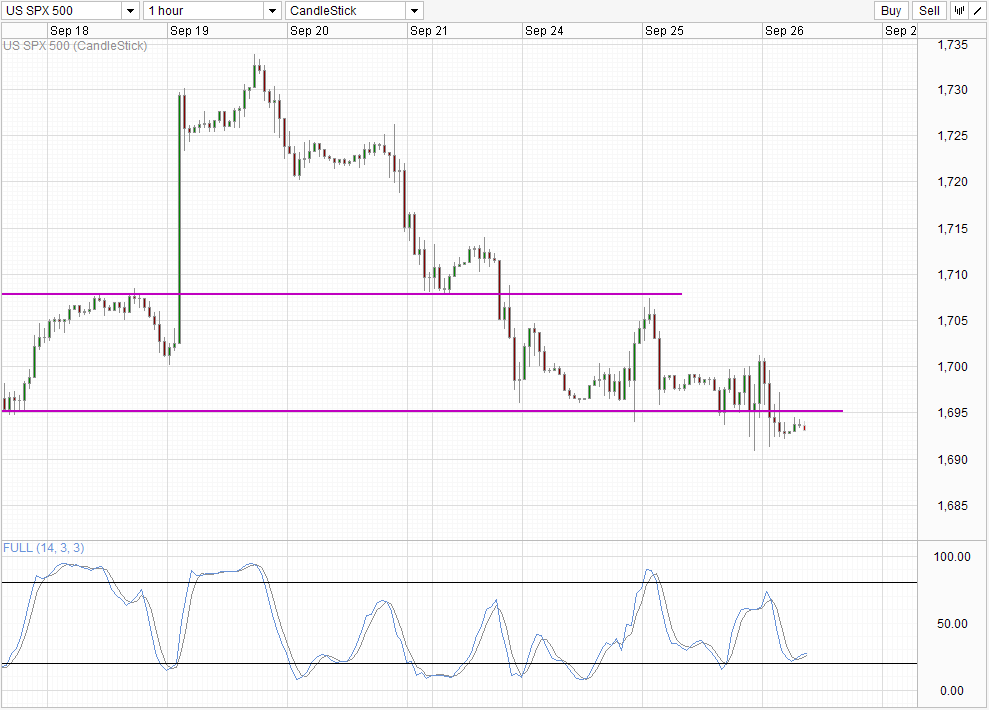
Interestingly, prices actually traded higher even though early US session managed to break 1,695 on the “good news is bad” flow. The rally that pushed prices from sub 1,695 to 1,700 is definitely technical driven. This can be seen from the fact that the rally stopped at the key 1,700 round figure, where technical bears drove prices back down again and managing to trade below 1,695 for an extended period of time compared to before. However, it should be noted that prices have yet to reach the swing low of yesterday’s US session, suggesting that the threat of technical bulls is not fully over.
Dow 30 Hourly Chart
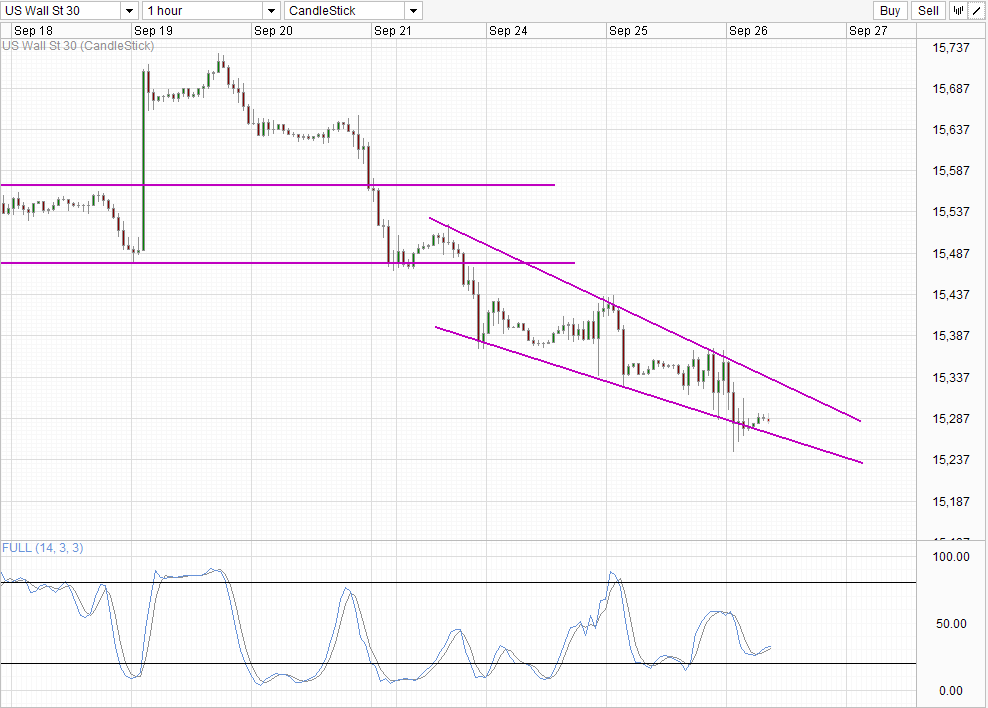
Dow 30 continues to be the more bearish one. Price action in Dow 30 tracks S&P 500 well, with each rally/decline timing matching. However, every single decline in Dow 30 is outdoing that of S&P 500, while the subsequent bullish pullback isn’t as strong. This resulted in a much clearer bear trend compared to S&P 500. Currently prices are trading below the key 15,300 support, and is looking likely to push lower even before the support turned resistance will be tested.
Due to the slight difference in bearish bias, should Dow 30 manage to climb up higher into the 15,300 – 15,350 consolidation zone, S&P 500 will stand a higher chance of pushing higher towards the 1,708 consolidation top provided that 1,695 resistance has already been breached by then. Conversely, if S&P 500 manages to break yesterday’s swing low, we could see an even stronger bearish sell-off in Dow 30 that will bring us closer to 15,000 round figure especially if the current wedge has already been broken.
More Links:
EUR/USD – Reverses Strongly to back above 1.35
AUD/USD – Continues to Drift Lower below 0.94
GBP/USD – Bounces well off Support at 1.60
This article is for general information purposes only. It is not investment advice or a solution to buy or sell securities. Opinions are the authors; not necessarily that of OANDA Corporation or any of its affiliates, subsidiaries, officers or directors. Leveraged trading is high risk and not suitable for all. You could lose all of your deposited funds.

Mingze Wu
Latest posts by Mingze Wu (see all)
- European Bourses Not Enjoying Bullish Winds From US Stocks - 17 April 2014
- More Aggressive Stimulus Possible Despite Premier Li’s Denial - 17 April 2014
- China March FDI -1.5% Y/Y vs +2.05% expected. First decline in more than a year. - 16 April 2014