10 Year Treasury prices jumped sharply, hitting a 5 weeks high following the non-tapering announcement by the Fed. The rally is not unexpected, as market has already priced in a 10% tapering outcome, and were already selling Treasury way before hand, resulting in prices being heavily depressed every since May, when the idea of a QE taper was thrown around. The only question remaining is whether current rally will be able to continue, or perhaps revert back lower in the near future.
As Fed will need to stop the monetary stimulus eventually, it is unreasonable to believe that yields will remain so low for such an extended period of time. Even if we do not see a tapering event in 2013, the same speculative play will happen again in 2014, and we will be able to see Treasury prices being depressed along the way.
Hourly Chart
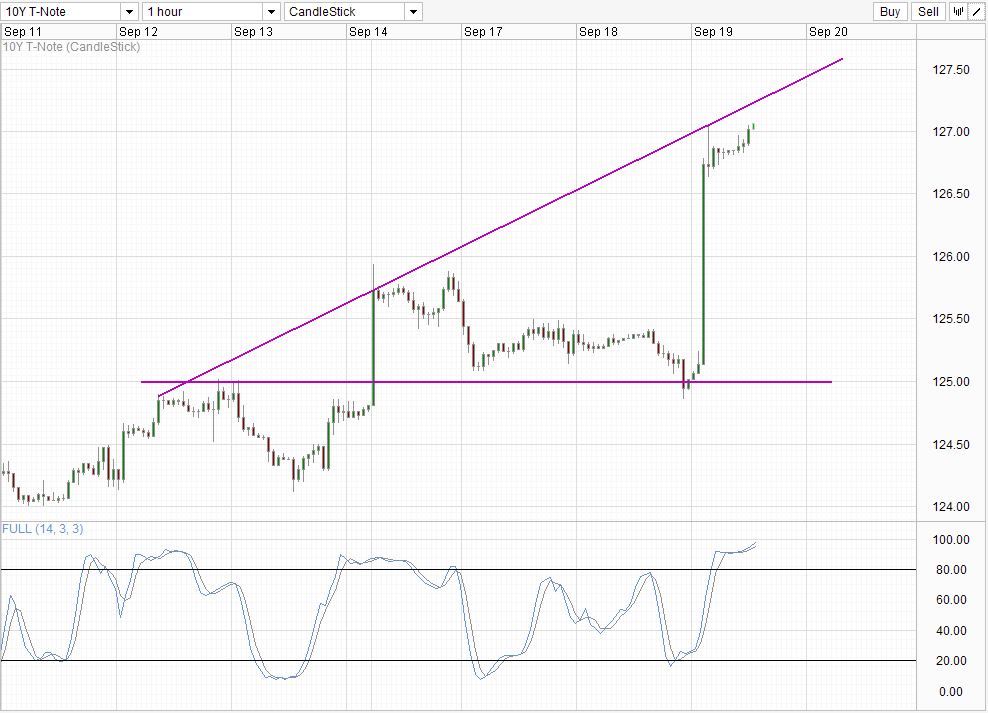
However, from a technical perspective, prices are actually looking bullish from 6th Sept low. The price of 123.40~ translate to an implied yield of 3.00%, which happens to be a strong psychological resistance level. Hence, bullish impetus for price was already there, and yesterday’s event risk merely sped up the rebound process, and perhaps extended it as well. Currently price is capped by the ascending trendline, but does not necessary negate the current bullish pressure, but simply suggest that a pullback may be possible especially since Stochastic readings are at the most Overbought levels since 5th August. If a bearish pullback materialize, Monday’s swing high may provide support and should price rebound higher from there, the likelihood for further bullish momentum will be higher. On the bearish front, price will need to break 125.0 in order to impair current bullish pressure and potentially accelerate prices lower faster. It is likely that market would be once again speculating a Taper announcement in end October should this happen, but if there is scant news on a tapering event yet prices are trading lower, the bearish follow-through may be suspect.
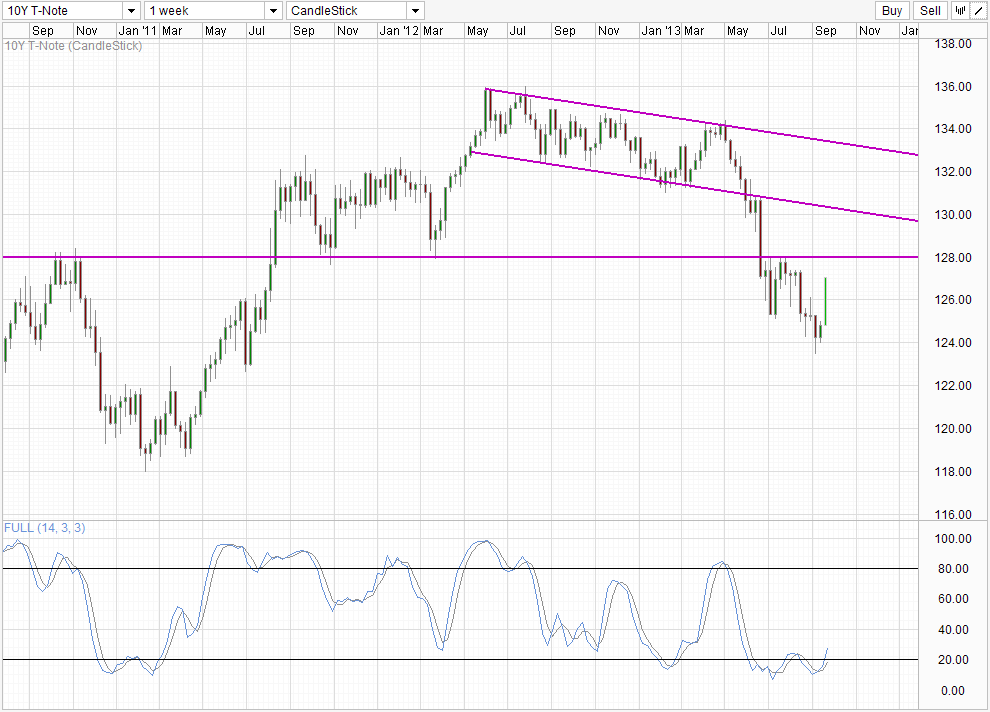
Weekly Chart is in line with the short-term bullish momentum. The key resistance for weekly chart is the 128.0 mark, and this suggest that there is indeed space for prices to push up higher in the short-term. However, the overall pressure remains on the bearish side even though Stochastic readings are showing us a bullish cycle signal. Even if 128.0 is broken, descending Channel Bottom will provide additional resistance, hence it will require a shift in fundamentals such as Fed announcing additional stimulus (impossible) in order for price to rally to such an extend. Without such shift in fundamentals, it is likely that price will eventually fall back as a tapering narrative will creep back in again.
More Links:
EUR/USD – Surges to Seven Month High above 1.35
AUD/USD – Surges to Three Month High above 0.95
GBP/USD – Surges to Eight Month High above 1.61
This article is for general information purposes only. It is not investment advice or a solution to buy or sell securities. Opinions are the authors; not necessarily that of OANDA Corporation or any of its affiliates, subsidiaries, officers or directors. Leveraged trading is high risk and not suitable for all. You could lose all of your deposited funds.

Mingze Wu
Latest posts by Mingze Wu (see all)
- European Bourses Not Enjoying Bullish Winds From US Stocks - 17 April 2014
- More Aggressive Stimulus Possible Despite Premier Li’s Denial - 17 April 2014
- China March FDI -1.5% Y/Y vs +2.05% expected. First decline in more than a year. - 16 April 2014