Weekly Chart
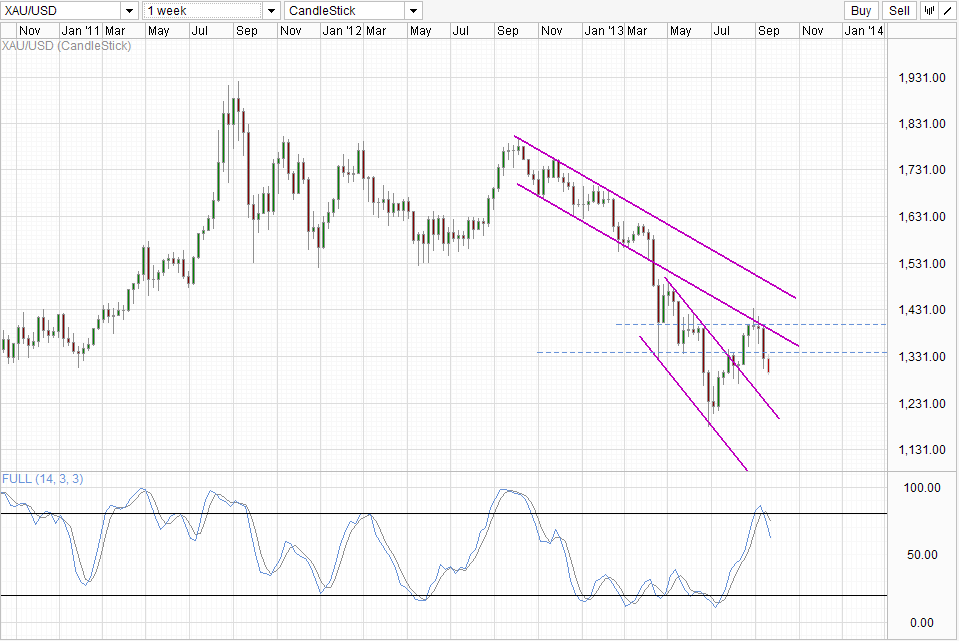
Nothing is more beautiful than seeing a reversal pattern getting into full flight, and that is how Gold is looking right now. To be fair, the original Evening Star bearish reversal pattern that was formed 2 weeks ago (see weekly chart below) was looking shaky, but bears more than made up for it with last week’s strong Opening Black Marubozu (imperfect bearish marubozu) which closed beneath the 1,330 – 1,345 support. We started this week looking a bit shaky due to the one time bullish push brought about by the withdrawal of Summers’ Fed Chairman bid. But even that turned out to be a blessing for bears in disguised as it helped to affirm the 1,330 support turned resistance, allowing those indecisive bears another opportunity to short. Currently we are trading below last week’s low, hence making up for the “imperfect” marubozu and potentially accelerating the decline towards 1,200 and sub 1,200 levels depending on where Channel Top may be if/when we reach there.
Hourly Chart
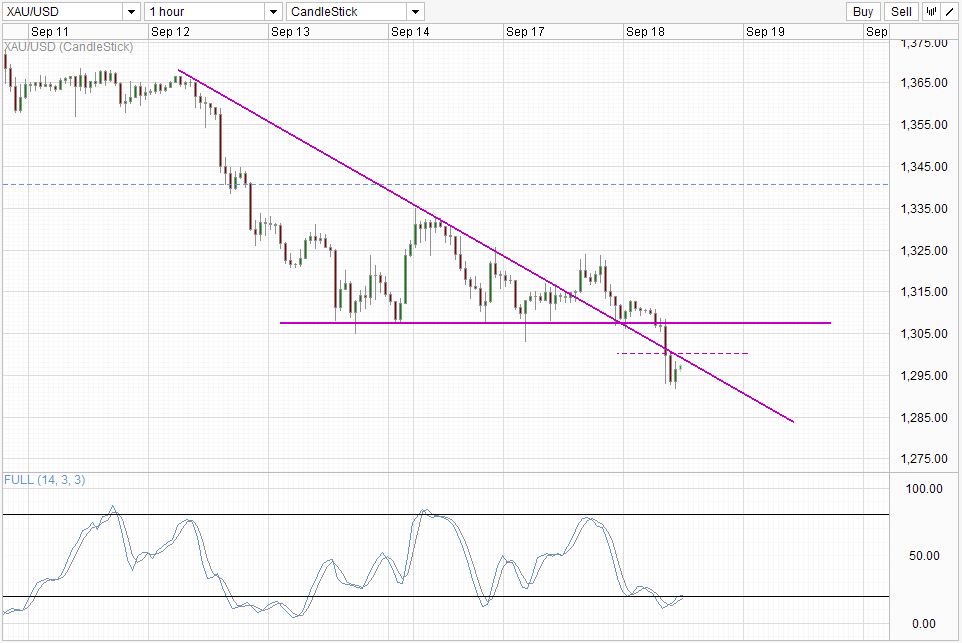
Looking at short-term chart, we can see prices breaking the psychological 1,300 level, but more importantly the more relevant descending trendline has been broken. We are experiencing a small pullback currently, and should the underside of the trendline holds, the chances of current leg extending lower ahead of FOMC meeting becomes higher. Nonetheless, a more likely scenario will see prices breaking the descending trendline by default as prices will be able to do so by simply holding at current levels. But as long as we stay below 1,300, bearish pressure will remain and we could still yet see prices straddling the descending trendline lower. By staying around current levels for an extended period of time, Stochastic readings will also be able to move higher and provide “rest” and space for stronger bearish movement in the future.
FOMC tapering announcement will obviously add in volatility, but considering that overall technical pressure remains lower both in the long and short-term, it is unlikely that any rallies resulting from FOMC announcement will be long-lasting. Furthermore, Gold prices have been heavily bearish since QE3’s inception. This is not saying that additional QE has resulted in Gold’s decline – correlation does not equate to causation, but it is fundamentally unreasonable to think that a continuation of QE (e.g. zero tapering) can push Gold prices higher. Even in the impossible scenario where Fed actually INCREASE stimulus, it will be debatable what the additional stimulus can do for Gold when $80 Billion Monthly has failed.
More Links:
S&P 500 and Dow 30: Fundamentals and Technicals Point to Explosive FOMC Event
EUR/USD – Settles below Long Term Resistance Level at 1.34
AUD/USD – Receiving Solid Support from Key Level of 0.93
This article is for general information purposes only. It is not investment advice or a solution to buy or sell securities. Opinions are the authors; not necessarily that of OANDA Corporation or any of its affiliates, subsidiaries, officers or directors. Leveraged trading is high risk and not suitable for all. You could lose all of your deposited funds.

Mingze Wu
Latest posts by Mingze Wu (see all)
- European Bourses Not Enjoying Bullish Winds From US Stocks - 17 April 2014
- More Aggressive Stimulus Possible Despite Premier Li’s Denial - 17 April 2014
- China March FDI -1.5% Y/Y vs +2.05% expected. First decline in more than a year. - 16 April 2014