Prices suddenly shot up after the close of Tokyo Stock Exchange, sending USD/JPY over the 100.0 line and more importantly crossing the highs of early Monday morning. Unfortunately, price remain below Friday’s swing high of 100.2, with the rally losing steam before the key level has been tagged. The reason for the rally is not immediately obvious, with the only news during the period being Japan Machine Tool Orders having declined 1.8% on a Y/Y basis. This may seem bearish but is actually a huge improvement from previous month’s -12.2%, and the best print since June 2012. That being said, it is highly unlikely that this is the main reason USD/JPY went up by 50 pips within 2 hours as this number is not heavily followed and tend not have huge volatility following its announcement traditionally. A stronger news that could have impacted risk sentiment more significantly would be the Chinese Industrial Production and Retail Sales numbers, both of which are better than expected. However, that was announced 30 mins before the start of the rally, and the price action during the hour was actually bearish instead of bullish. Looking across all other USD pairs, there seems to be some slight USD appreciation across board, but the magnitude is way smaller compared to USD/JPY, hence suggesting that the broad USD strengthening was actually due to the spilling over of USD/JPY rally as oppose to USD strength driving USD/JPY higher. By process of elimination, we are left with speculative action as the only reason why the sudden rally occurred.
Hourly Chart
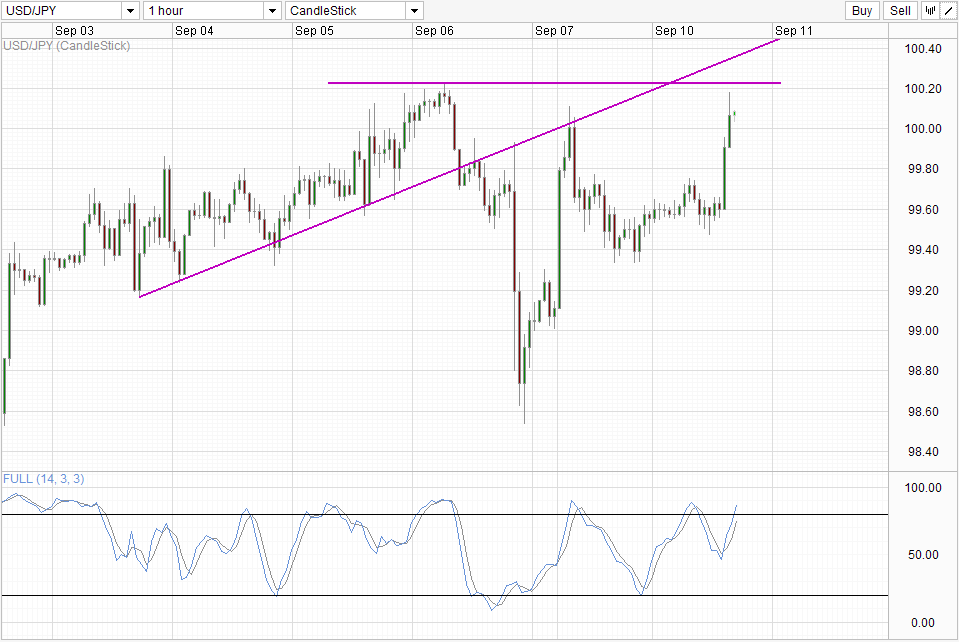
If the conclusion is correct, then the chances of prices breaking 100.20 becomes lower, as there isn’t any fundamental reason for further rally. Stochastic readings suggest that current prices are overbought as well, lowering the likelihood of a bullish push even further. If 100.20 indeed holds, 99.4 – 99.6 opens up as the next level of support with a further bearish target at 98.5.
Weekly Chart
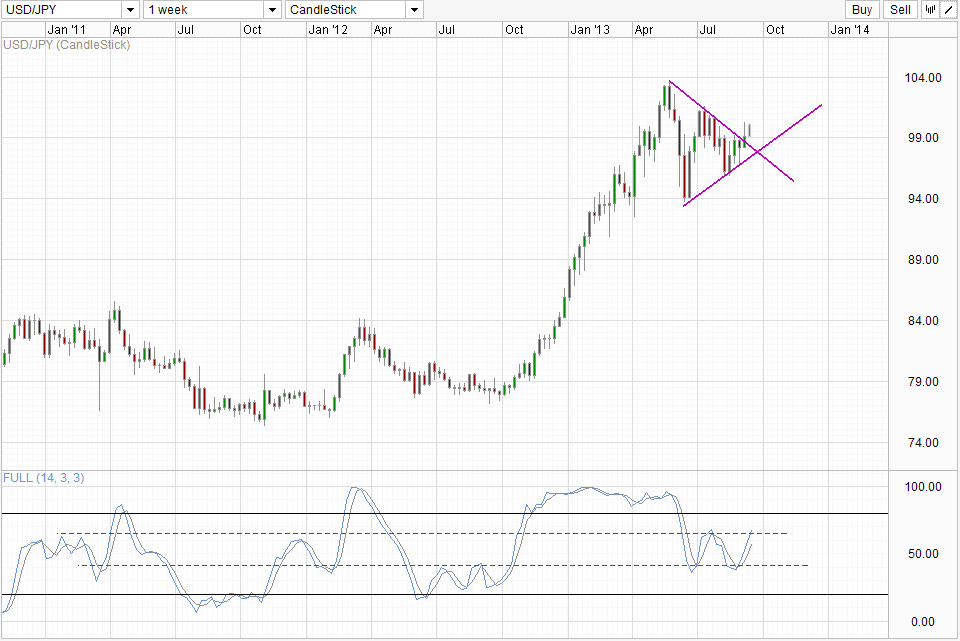
Weekly Chart does not agree with the short-term outlook, with prices looking at a bullish breakout from the Triangle/Pennant that may bring us to 104.0 or perhaps even further. Stochastic readings favors a move higher, but in order to affirm the bullish signal that did not start from the Oversold region, the Stoch curve would need to push above the recent peak. The same could be said about price which should ideally push above 101.50 which is the swing high back in July to affirm current breakout which should give us at the very least a Gartley pattern if not a fresh bullish push above 104.0 if the Pennant pattern proves to be correct.
More Links:
GBP/USD – Places Pressure on Resistance Level at 1.57
AUD/USD – Tests Resistance Level around 0.9250 at Six Week High
EUR/USD – Surges to Two Week High above 1.3250
This article is for general information purposes only. It is not investment advice or a solution to buy or sell securities. Opinions are the authors; not necessarily that of OANDA Corporation or any of its affiliates, subsidiaries, officers or directors. Leveraged trading is high risk and not suitable for all. You could lose all of your deposited funds.

Mingze Wu
Latest posts by Mingze Wu (see all)
- European Bourses Not Enjoying Bullish Winds From US Stocks - 17 April 2014
- More Aggressive Stimulus Possible Despite Premier Li’s Denial - 17 April 2014
- China March FDI -1.5% Y/Y vs +2.05% expected. First decline in more than a year. - 16 April 2014