Treasuries gained for a second day, but only marginally as seen from Benchmark 10Y prices, closing at 124.40 vs the 124.26 close of last Friday. The gains have been attributed to further speculation that the Fed will choose to be less aggressive, or perhaps even choosing not to taper monetary stimulus during this month’s FOMC meeting following last Friday’s lower than expected NFP print. This is an interesting observation, and may explain in part the bullish overreaction seen in US Stocks yesterday.
Hourly Chart
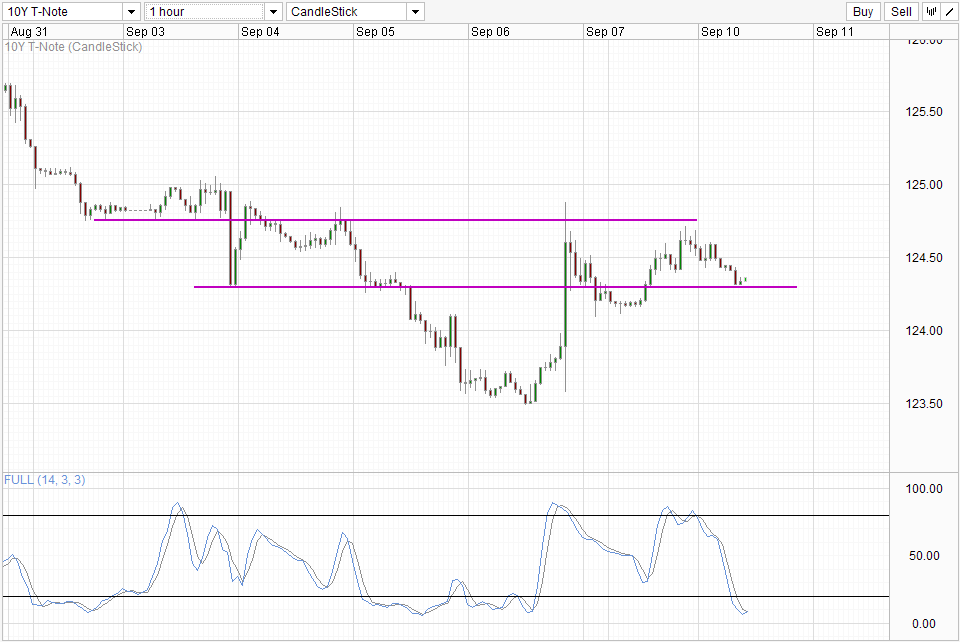
As there wasn’t any major economic news release during US session, we can observe clean technical reaction/sentiment of Treasuries traders. It seems that pressure remains firmly on the downside despite the strong rally seen on Friday. Yesterday’s rally failed to even tag the 124.75 soft support turned resistance, not to mention hitting the post NFP highs. 10Y prices dipped subsequently, highlighting the failed bullish bid and underlining the strong bearish pressure that remains in play. Currently we are trading around the 124.30 soft support with Stochastic readings making a U-turn, lending strength to the aforementioned support level and opens up a possibility for price to move back to 124.50.
Daily Chart
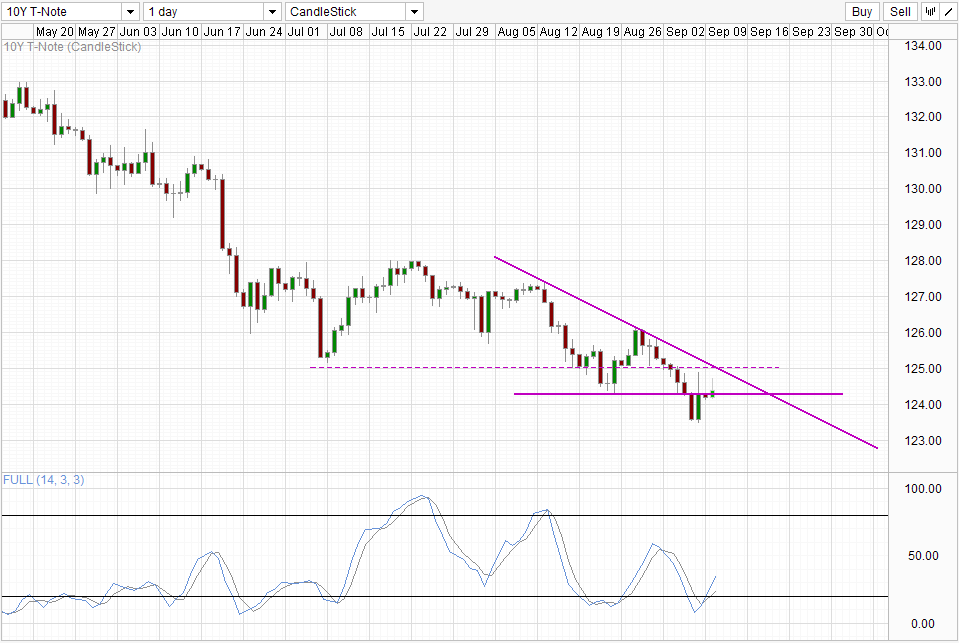
124.30 level is even more significant on the Daily Chart, with the level representing the previous swing low back in August. By trading below it, the bearish sell-off since May 2013 can be regarded as continuing, but trading above it suggest that long-term bearish momentum may be stalling. Case in point look at 126.0 which was the swing low in June. Prices broke below that level in July but quickly recovered, resulting in sideways movement between 126 – 128 for the entire month of July. The same could happen again if 124.3 holds this time round. Furthermore, if price managed to push above the descending trendline and the 125.0 round figure, there could be additional short-term pressure that can derail the long-term bearish push.
Stochastic readings suggest that we are currently at the start of bullish cycle, favoring the bullish scenario mentioned above. But considering that recent successive peaks have been lower, there is every chance that a lower stoch peak may form this time round as well. As such, bulls seeking a sustained push should wait for price to clear the 125.0/Descending Trendline confluence for confirmation to prevent a quick pullback scenario similar to the one back in late August.
More Links:
GBP/USD – Places Pressure on Resistance Level at 1.57
AUD/USD – Tests Resistance Level around 0.9250 at Six Week High
EUR/USD – Surges to Two Week High above 1.3250
This article is for general information purposes only. It is not investment advice or a solution to buy or sell securities. Opinions are the authors; not necessarily that of OANDA Corporation or any of its affiliates, subsidiaries, officers or directors. Leveraged trading is high risk and not suitable for all. You could lose all of your deposited funds.

Mingze Wu
Latest posts by Mingze Wu (see all)
- European Bourses Not Enjoying Bullish Winds From US Stocks - 17 April 2014
- More Aggressive Stimulus Possible Despite Premier Li’s Denial - 17 April 2014
- China March FDI -1.5% Y/Y vs +2.05% expected. First decline in more than a year. - 16 April 2014