Crude Oil traded lower yesterday, falling from a high of 112.56 Asian high to a low of 109.47 during late US session. One could automatically assumed that the decline was due to the a lower implied demand of Crude Oil seen from the latest Department of Energy inventory count, but that would be incorrect. Despite Crude Inventory growing by 2.5 million more than expected, Crude prices actually gained higher by the time the dust has settled. Prices did fall 30 cents lower immediately when the numbers were released, but rebounded higher equally quickly, hitting a post DOE high of 110.75. This move is inexplicable by fundamentals as sentiment of the market was actually bearish due to fears of Syrian unrest easing slightly during the period, as evident by the huge decline seen post Asian highs yesterday. There was simply no strong fundamental reasons why Oil prices should be trading higher back then.
Hourly Chart
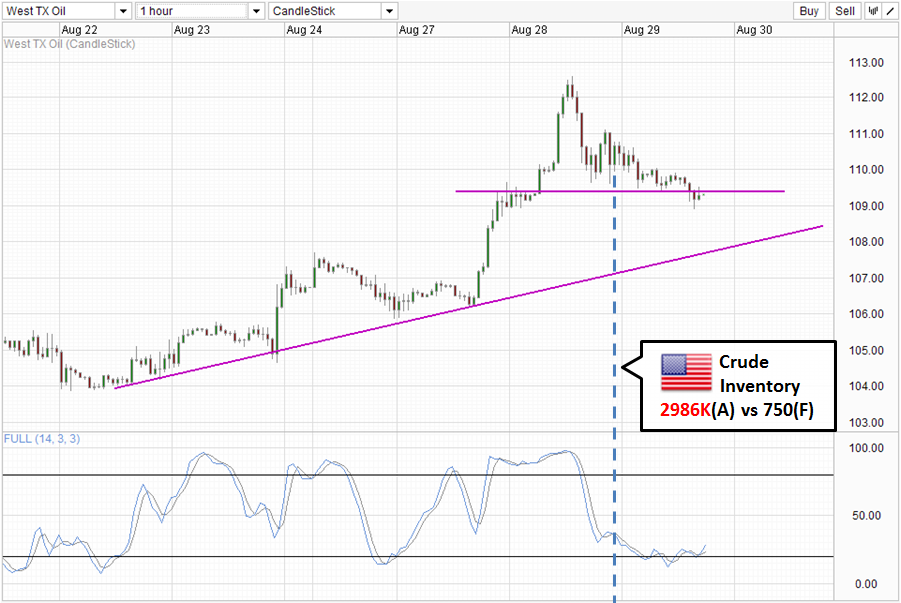
Technicals may be able to help us solve the mystery. 110.0 round figure is a strong psychological level and a significant support/resistance for price action in the past. As such, it is not surprising to see this level holding despite the strong bearish winds blowing during the US session. Nonetheless, it should be noted that bearish winds did win out in the end, with 110.0 eventually broken during late US hours. Currently price has just broken the 109.4 support but has found some slight support around the 109.0 which happens to be the consolidation floor of 27th August US session. If price manage to break lower from 109.0, the next level of bearish target would be the rising trendline, which is the confluence with Monday’s high if we manage to reach there in the next few hours.
However, stoch readings suggest that we are currently Oversold, and noting that the entire 109.0 – 109.4 band can be regarded as a support band, we could still see prices potentially pushing back up again. 110.0 should preferably be broken before we discuss further bullish targets such as 111.0 and the recent swing high of 112.5.
Daily Chart
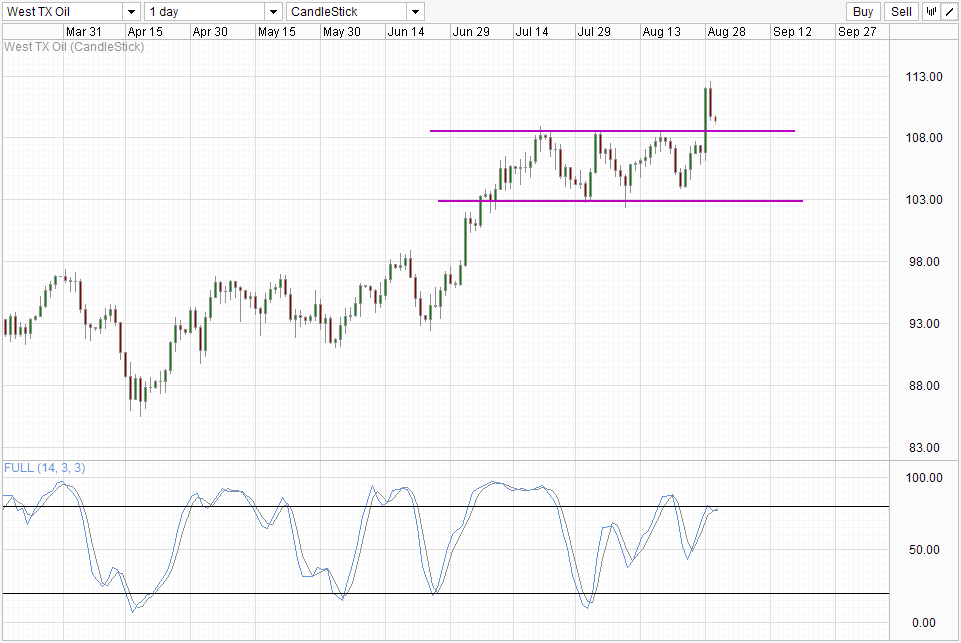
Daily Chart is still bullish despite the long red candle. The breakout of 108.5 ceiling is still in play, and a breach back into the sideways channel is needed for invalidation to happen. Stochastic readings suggest that a bearish cycle may be imminent with Stoch lines crossing over the signal line pointing lower. However, noting that we have a divergence between the recent stoch peaks versus price peaks, current bearish cycle signal is impaired, and we could still see stoch readings pushing back deeper into the Overbought region where it has ventured before.
More Links:
USD/INR Technicals – Bulls Not Dying Despite RBI Intervention
EUR/USD Technicals – 1.33 eyed as bears looking for payback
AUD/USD Technicals – Attempting To Hit 0.898 from 0.894 bounce
This article is for general information purposes only. It is not investment advice or a solution to buy or sell securities. Opinions are the authors; not necessarily that of OANDA Corporation or any of its affiliates, subsidiaries, officers or directors. Leveraged trading is high risk and not suitable for all. You could lose all of your deposited funds.

Mingze Wu
Latest posts by Mingze Wu (see all)
- European Bourses Not Enjoying Bullish Winds From US Stocks - 17 April 2014
- More Aggressive Stimulus Possible Despite Premier Li’s Denial - 17 April 2014
- China March FDI -1.5% Y/Y vs +2.05% expected. First decline in more than a year. - 16 April 2014