Kiwi Dollar continued the uptrend that started from 14th August, pushing to as high as 0.8125 during early Asian hours. Price was expected to be bullish due to last Friday’s last ditch bullish effort, allowing NZD/USD to close above the 0.81 – albeit by the skin of their teeth at 0.81036. However, the resultant bullishness is nothing spectacular, with price trading back below 0.81 at one point despite stronger economic numbers early today. Performance Service Index for the month of July grew to 58.1, while Producer Price Outputs grew 1.0% vs 0.8% previous. Producer Price Inputs growth rate fell from 0.8% to 0.6%, but that is good news as it means cheaper cost of production for producers, allowing for higher margins and higher profitability all round. Granted that these 3 numbers are not earth shakers, but it seems strange that bullish conviction did not make used of it to send NZD/USD higher.
Hourly Chart
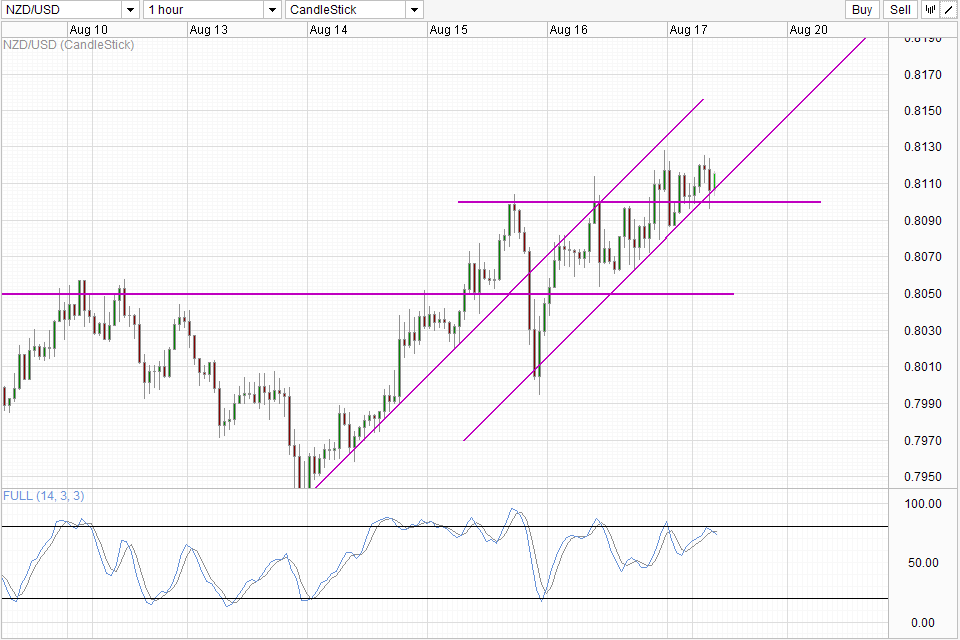
Perhaps bulls are feeling a bit tentative, resulting in this morning’s rally unable to surpass the highs of last Friday’s. Nonetheless 0.81 managed to stay firm, while staying above the bottom of the newly formed Channel. Interestingly, stochastic readings are currently pointing lower with Stoch curve barely pushing above 80.0 in the hours prior. If we are currently under a strong bullish mandate, then we can assume that Stoch readings will be able to push deeper into the Overbought region in order to “complete” the full bullish cycle. However, as bullish mandate does not look so hot right now, the possibility of Stoch curve peaking here cannot be ignored and we may need to consider a possible scenario where price may break Channel Bottom and 0.81 for a return of bearish impetus for the rest of the week.That being said, if Channel Bottom holds, Channel Top will become the next viable bullish target. Acceleration upwards may occur if we are able to clear the 0.8128 Friday high, and help to booster current unconvincing bulls.
Weekly Chart
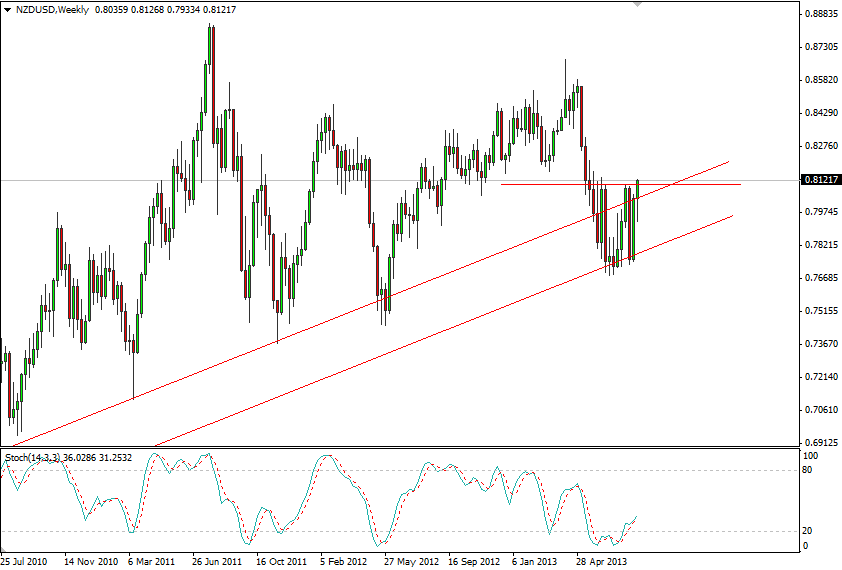
Weekly Chart shows the potential bullish target around 0.85 should 0.81 is confirmed to be broken. Stochastic readings here are much more optimistic, with a new bullish cycle in its infancy, suggesting that a bull run from here can be potentially far reaching, in line with the 0.85 long-term target expectation. However, do not expect the rally to be smooth, as resistance may be found around 0.82 which is the floor of Q4 2012. Beyond 0.82, there are other relatively weaker resistances around 0.84 and other minor structural trendlines that bulls will need to negotiate with.
From a fundamental perspective, market is expected RBNZ to raise rate by more than 75 bps (e.g. 3 x 25 bps raises) within the next 12 months. As such, long term yield curve also support a stronger NZD/USD moving forward, in line with what the technicals tell us – provided the 0.81 breakout has been confirmed.
More Links:
GBP/USD – Maintains the Two Month High above 1.56
AUD/USD – Settles just under Resistance at 0.92
EUR/USD – Eases away from Resistance at 1.34
This article is for general information purposes only. It is not investment advice or a solution to buy or sell securities. Opinions are the authors; not necessarily that of OANDA Corporation or any of its affiliates, subsidiaries, officers or directors. Leveraged trading is high risk and not suitable for all. You could lose all of your deposited funds.

Mingze Wu
Latest posts by Mingze Wu (see all)
- European Bourses Not Enjoying Bullish Winds From US Stocks - 17 April 2014
- More Aggressive Stimulus Possible Despite Premier Li’s Denial - 17 April 2014
- China March FDI -1.5% Y/Y vs +2.05% expected. First decline in more than a year. - 16 April 2014