Hourly Chart

Tokyo stocks took a beating today with Nikkei 225 closing 2.12% lower, while Topix closed 1.67% lower. However, if we assumed that prices opened bearishly in the morning, we would be highly mistaken. Looking at hourly chart above, we can see that prices actually traded higher during the 1st 2 hours of trade, most probably spurred by a weakening Yen due to latest data showing Japanese buying highest amount of Foreign Bonds in a month since 2010 August – amounting to 1.6 Trillion Yen, more than double that of last month’s 690 Billion. The reason price traded lower was due to the rejection of 14,000 resistance, which is confluence with the swing high back on 8th August, and the 61.8% Fib on the Monthly Chart (see below). Furthermore, US market was bearish yesterday, dragging global risk sentiment and thus Nikkei 225 lower with it, and is not due to Nikkei 225’s inherent weakness. Therefore, a move back towards the overhead Kumo within the first 2 hours of trade after bouncing from the support of 13-14th August should not come as too much of a surprise, and actually opened up 14,000 as a bullish target early today.
That obviously did not happen, as price subsequently traded lower, dipping below the 13,750 support and swing low of yesterday. The catalyst? Finance Minister Aso saying that a sales tax increase is justifiable due to strong growth figures from Q2. On top of this, Aso twisted the knife by dismissing rumors that Abe will be lowering corporate taxes as a sweetener for the sales tax increase, before adding on and saying that even if the Japanese Government lower corporate taxes, it is unlikely to impact the economy in any meaningful way. This double whammy sent Japanese stocks sharply lower, resulting in price breaking the Kumo and opening the next level of consolidation as the bearish target. Currently we’re experiencing some level of pullback, with price testing Senkou Span B again. If the resistance level hold, we could see acceleration towards the 13,450 – 13,700 consolidation.
Monthly Chart
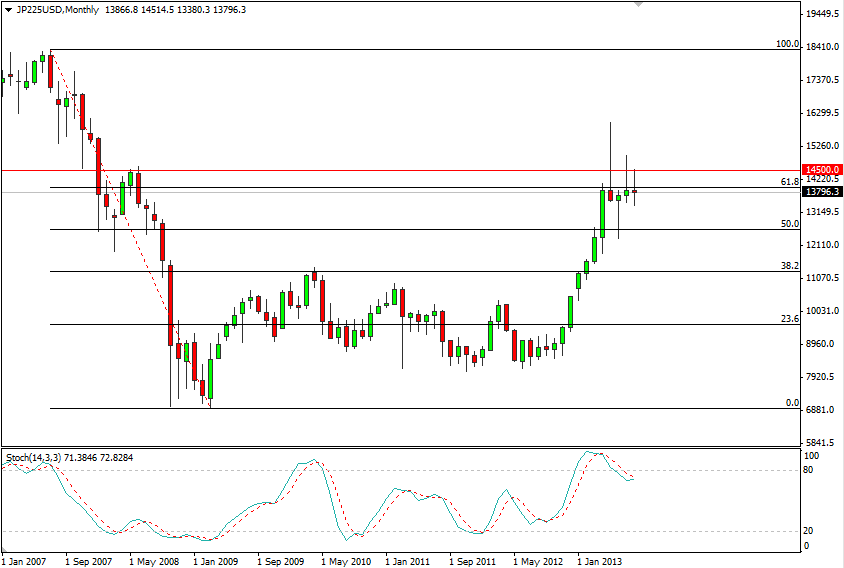
Monthly Chart is leaning towards the bearish side, with Stochastic readings pushing below 80.0 and candles continuing to stay below the 61.8% Fib retracement. As long as readings stay below 14,000, the risk of a move towards 50.0% Fib will remain.
More Links:
NZD/USD – Heading towards 0.81 on Manufacturing Growth
GBP/USD – Back Through 1.55 Again
AUD/USD – Rests on Support at 0.91
This article is for general information purposes only. It is not investment advice or a solution to buy or sell securities. Opinions are the authors; not necessarily that of OANDA Corporation or any of its affiliates, subsidiaries, officers or directors. Leveraged trading is high risk and not suitable for all. You could lose all of your deposited funds.

Mingze Wu
Latest posts by Mingze Wu (see all)
- European Bourses Not Enjoying Bullish Winds From US Stocks - 17 April 2014
- More Aggressive Stimulus Possible Despite Premier Li’s Denial - 17 April 2014
- China March FDI -1.5% Y/Y vs +2.05% expected. First decline in more than a year. - 16 April 2014