Hourly Chart
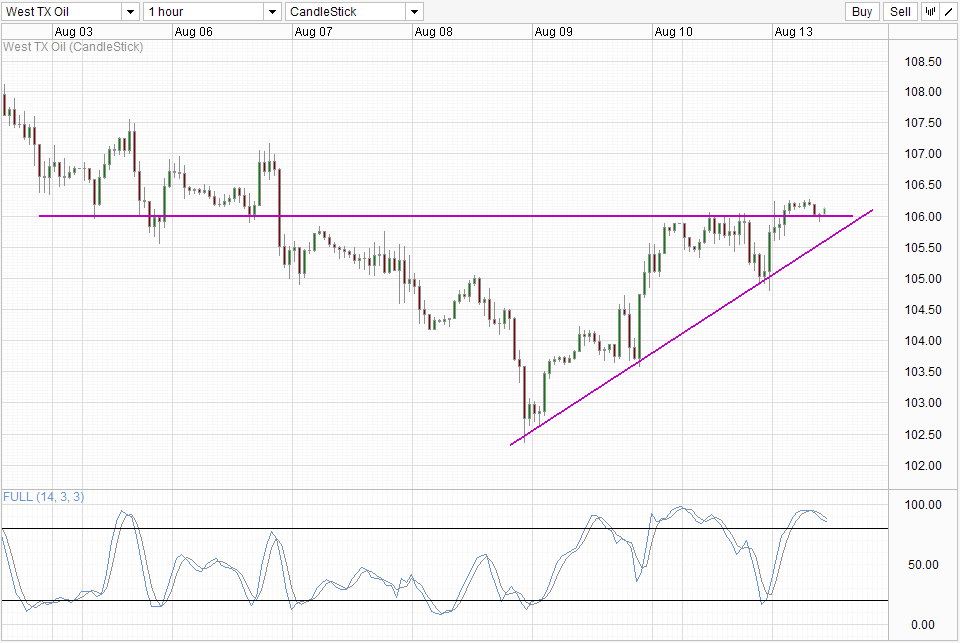
Crude oil found support via the ascending trendline following the bearish rejection of 106.0 resistance. The subsequent rebound at the trendline was reasonably expected due to the confluence with the 105.0 round figure which happens to be the support of 7th Aug and swing high of 8th August. However, the break of 106.0 is unexpected, as there wasn’t any fundamental impetus that could have drove price up against the 106.0 wall which has held so strongly yesterday.
Looking at broad US market, risk sentiment appears to be down with S&P 500 closing 0.12% lower and DJI 0.04% lower. Hence we can safely rule out risk appetite as the smoking gun. In terms of potential market moving news, we didn’t have anything significant coming out from US coasts when the strong rebound off 105.0 happened. There was the Energy Information Administration (EIA) Weekly Update for Gasoline and Diesel. This is generally not a prime mover for Crude Oil, but even if it did, numbers actually pointed to cheaper Gasoline and Diesel prices, which would imply cheaper Crude prices moving forward – not a good reason to send Crude above 106.0.
Speculative demand wise, it seems that we have a slight pullback in net long US Oil Futures – the first in 6 weeks. Even though the decline is nothing to behold with respect to recent spike, it is important to note that the decline in speculative long positions happened when price broke 106.0 successfully, reaching a low of 102.5 during the week. Hence, this week’s Commitment of Traders numbers would be highly critical. Ideally we should at least see Net Long positions regaining back the decline of last week, if not more, as prices are now back above 106.0
As COT numbers are always lagging, perhaps price may have already dipped back below 106.0 and potentially below the trendline before this Friday’s numbers tell us that current 106.0 break is unsustainable. As such, traders may wish to utilize other technical indications to confirm if current bullish trend is sustainable or not. With Stochastic readings currently pointing lower but nonetheless above the 80.0 mark, we can see if a bearish cycle signal can take hold or perhaps be thwarted should readings bounce from 80.0 to form a trough within the Overbought region. It is likely that the test of 80.0 will coincide with a test of the rising trendline, which can add as yet another confirmation.
On balance of things, it seems that if Crude prices manage to stay above 106.0 for the rest of today, we could potentially see the rising trendline pushing prices towards 107.0 during US opening hours. Should that truly happen, the importance of COT numbers supporting a continued bullish move will return, and may provide us the fundamental reason needed for a continued push back towards 110.0 once more.
More Links:
GBP/USD – Looking back towards Key 1.54 Level
AUD/USD – Reverses Strongly back towards 0.91
EUR/USD – Retests Support at 1.33
This article is for general information purposes only. It is not investment advice or a solution to buy or sell securities. Opinions are the authors; not necessarily that of OANDA Corporation or any of its affiliates, subsidiaries, officers or directors. Leveraged trading is high risk and not suitable for all. You could lose all of your deposited funds.

Mingze Wu
Latest posts by Mingze Wu (see all)
- European Bourses Not Enjoying Bullish Winds From US Stocks - 17 April 2014
- More Aggressive Stimulus Possible Despite Premier Li’s Denial - 17 April 2014
- China March FDI -1.5% Y/Y vs +2.05% expected. First decline in more than a year. - 16 April 2014