Gold prices suffered a bearish breakout last Friday, trading below 1,300 before the weaker than expected NFP numbers pushed USD weaker and hence Gold higher. Price hit a high of 1,318.68 following the events risk, but was unable to break the Channel Top (see Weekly Chart below). This resulted in last week closing on a bearish note, with bearish expectations for price to head lower early this week.
That however did not happen. Price actually started trading higher and pushed above Friday’s high this morning thanks to risk aversion of the Asian markets. This allow safe haven currencies such as Gold to rally up higher. Furthermore, we had some scare from the Oceanic region due to China’s ban of milk powder from New Zealand and Australia due to contamination woes. This resulted in the already battered risk appetite to retreat even further, allowing Gold to break above the Channel Top.
Weekly Chart
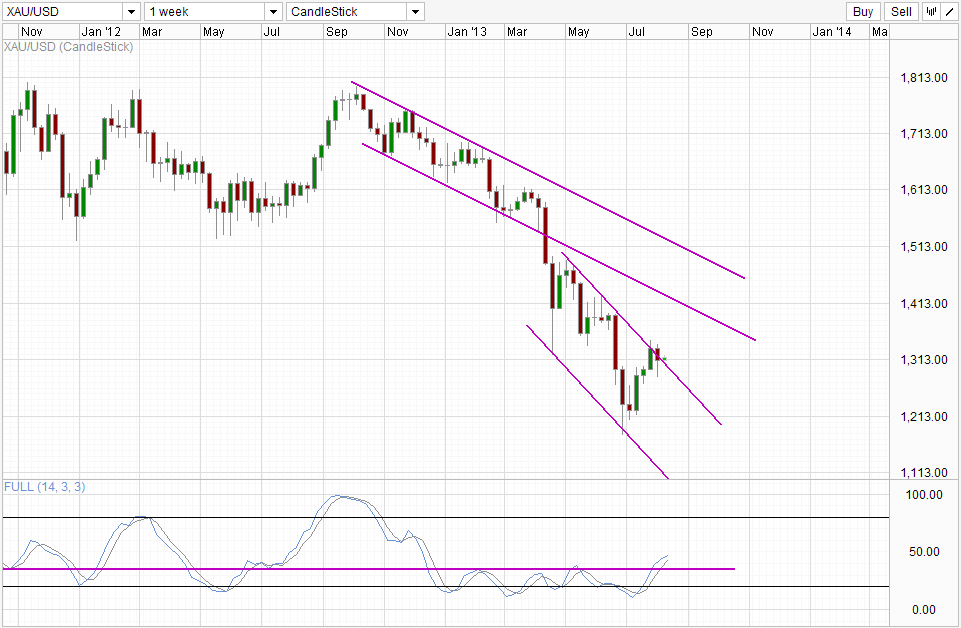
From the weekly chart, we can see current candle peeking out. Stochastic readings has also broken a “resistance” level of its own, suggesting that a bullish cycle may be in play currently, which increases the likelihood of price pushing towards the 1,350 resistance. If the level is broken, we would stand a better chance of heading towards the Channel Bottom of the overhead channel. However, it remains to be seen whether current peeking can be interpreted as a bullish breakout of the Channel. Prudence is definitely recommended here considering that the price did not rally following the “break”, but we merely stumbled across the line. Furthermore, as this is a Weekly Chart channel, the precision of current Channel may not be that high, and hence a stronger bullish reaction (preferably above 1,350) may be required before stronger convictions can take place.
CFTC Commitment of Traders
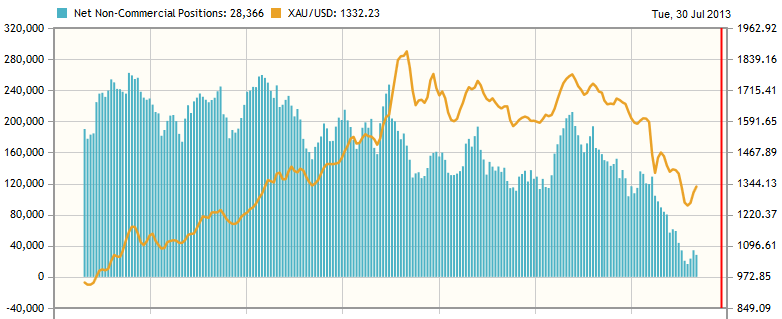
From a fundamental point of view, it seems that Non-Commercial Long positions has fallen slightly just when price is heading towards critical resistance (swing low of Jan 2011). This is disconcerting as a large part of the rally from 1,200+ was supported from funds purchases – e.g. speculative long positions. A fall in speculative positions suggest that some of the funds have cleared a little bit of their positions, which puts a dent on the long-term bullish probability. The good news is that there hasn’t been any major sell-offs spotted yet, and hence the dip in long positions could merely be a temporary blip as funds lower their exposure risks. This increases the importance of price clearing the 1,340 – 1,350 resistance as it would remove all doubts which the declining net-long positions may bring.
More Links:
EUR/USD – Continues to Place Pressure on Resistance at 1.33
AUD/USD – Moves Down Through 0.89 to Three Year Low
NZD/USD – Bears Attracted by Spoilt Milk
This article is for general information purposes only. It is not investment advice or a solution to buy or sell securities. Opinions are the authors; not necessarily that of OANDA Corporation or any of its affiliates, subsidiaries, officers or directors. Leveraged trading is high risk and not suitable for all. You could lose all of your deposited funds.

Mingze Wu
Latest posts by Mingze Wu (see all)
- European Bourses Not Enjoying Bullish Winds From US Stocks - 17 April 2014
- More Aggressive Stimulus Possible Despite Premier Li’s Denial - 17 April 2014
- China March FDI -1.5% Y/Y vs +2.05% expected. First decline in more than a year. - 16 April 2014