Hourly Chart
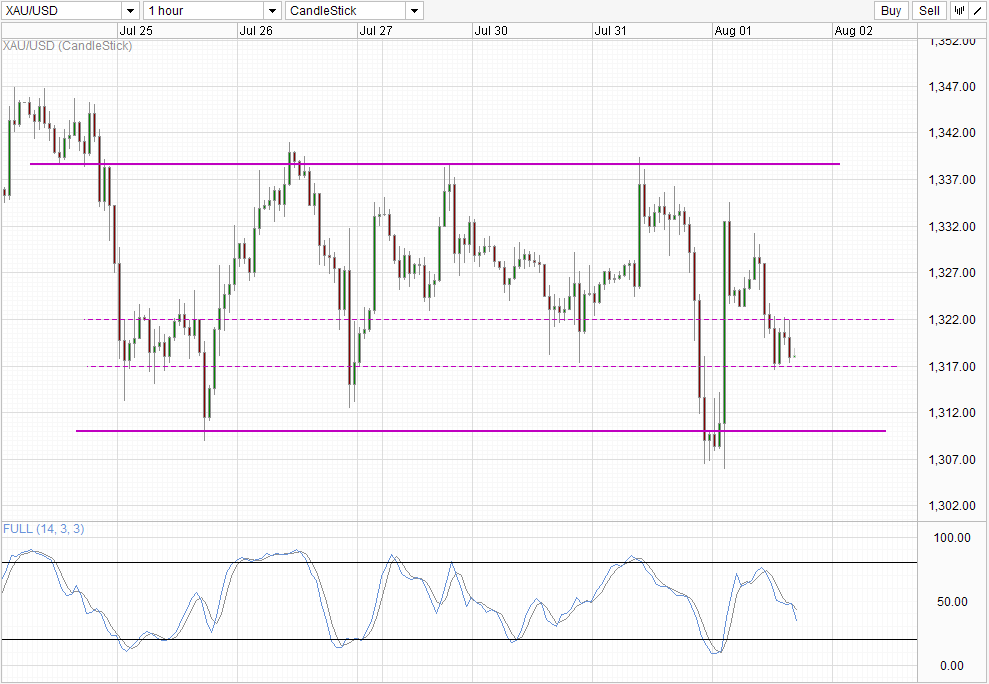
Gold suffered a massive sell-off yesterday during European hours and early US trade. Price fell from above 1,330 to sub 1,310 in a matter of hours. The exact catalyst is unclear, as risk sentiment is actually bearish led by the fall in Nikkei 225. European bourses also gaped lower across the board, adding fuel to the anti-risk train, but even that wasn’t able to keep safe-haven Gold from heading lower. This highlights the current bearish sentiment of Gold – or does it?
Looking at recent price action, price was already trading sideways within 1,310 – 1,340 consolidation. The decline seen during European hours actually started much earlier, which was initiated from a rebound from the 1,340 resistance during early Asian hours. There is evidence for this assertion, as gold prices actually stayed close to the 1,310 support following the slide, instead of accelerating lower after breaking out. This suggest that bears are happy with simply seeking the lower Channel Floor, which is not what you would expect if the decline was more fundamentally driven.
Some may argue that traders were hesitant about selling further with FOMC rate decision looming just round the corner, that may be true, but obviously the threat of a dovish FOMC did not stop people from selling to begin with. Hence, using technical bears as a plausible answer sounds more reasonable.
In any case, FOMC statement did turned out more dovish than expected, sending Gold above 1,330 once more following the statement release. However this time round price did not manage to tag 1,340, and fell back quickly instead. Early Asian trade saw bulls trying to push up towards 1,340 once more, but the attempt this time round ended in a bigger disappointment with price quickly collapsing towards the 1,317 soft support. Some may say that this is a proof that Gold sentiment is inherently bearish, but if we consider that the same rally/decline behavior was also seen in US Stocks, perhaps the decline in Gold prices is less related to its inherent bearishness but rather on the mixed interpretation one may get from the FOMC Statement.
What about the subsequent bearish follow-through? This can be easily explained away if we consider that the resistance zone can be labelled from 1,330 – 1,340 (more obvious on Weekly Chart, not shown here). Hence the decline during today’s Asian hour can be regarded as a rebound off the 1,330/1,340 resistance. As this decline did not start from the extremities of the resistance, we should not expect price to head towards the extremities of support either. This increase the likelihood of 1,317 holding, and we could yet see another move back towards 1,330 if the technical influence continues.
More Links:
AUD/USD – Rate Cut Expectation Increases as Economic Numbers Miss Mark
USD/SGD Technicals – Supported by 1.27 Round Figure
GBP/USD – Drops Down Through 1.52 to Two Week Low
This article is for general information purposes only. It is not investment advice or a solution to buy or sell securities. Opinions are the authors; not necessarily that of OANDA Corporation or any of its affiliates, subsidiaries, officers or directors. Leveraged trading is high risk and not suitable for all. You could lose all of your deposited funds.

Mingze Wu
Latest posts by Mingze Wu (see all)
- European Bourses Not Enjoying Bullish Winds From US Stocks - 17 April 2014
- More Aggressive Stimulus Possible Despite Premier Li’s Denial - 17 April 2014
- China March FDI -1.5% Y/Y vs +2.05% expected. First decline in more than a year. - 16 April 2014