No great movements from EUR/USD yesterday, with price action staying close to Friday’s consolidation zone between 1.326 – 1.3295 for the most part, until early US session saw a rebound in USD strength, sending risk currencies across the board broadly lower. However that only translated to a fall of less than 50 pips for the EUR/USD, with prices finding support around 1.325, round figure and swing high of 24th July. Prices then rebounded throughout the rest of the US trading session, finding resistance around 1.326.
Interestingly, we are actually trading marginally lower during early Asian session despite risk appetite broadly higher due to a rebound in Nikkei 225. This should generally invoke a weaker USD, and not a higher Greenback, and the takeaway lesson that we can have from here is that USD is kind of running on its own right now. The question that remains though, is whether the sell off of yesterday is still in play, or should we be looking at the broader uptrend that started back on 10th July.
Hourly Chart
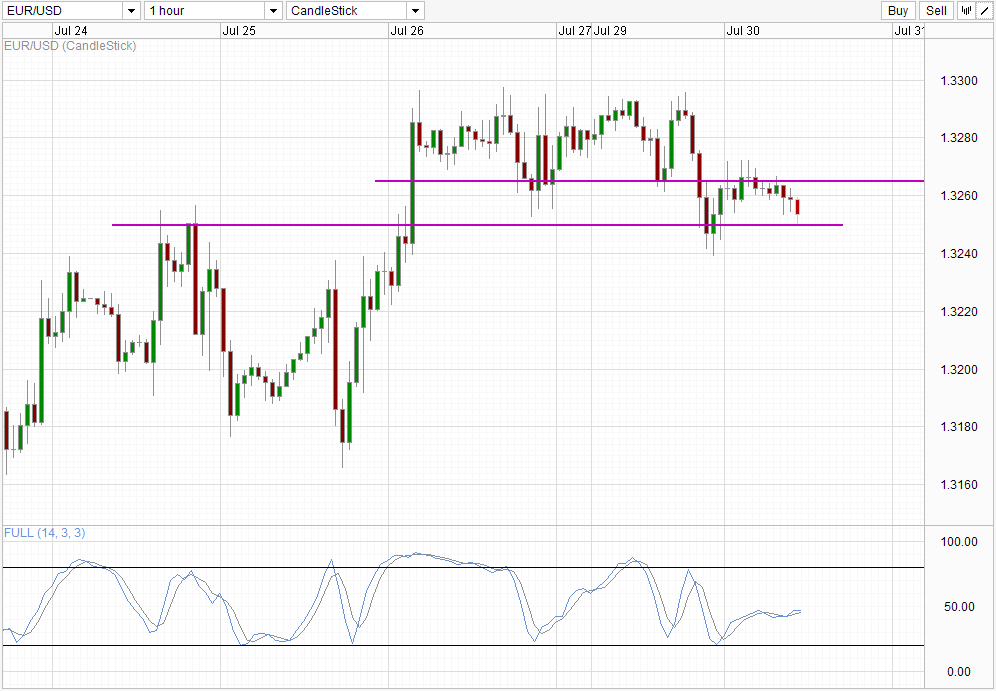
Looking at Stochastics indicator, readings are neither bullish nor bearish. Yes it seems that we are currently in the midst of a bullish cycle that started from the rebound of yesterday’s early US session, in line with the price rebound of 1.325. However, the stochastic curve is also mostly flat, with current gradient looking likely to cross the Signal line to form an interim trough which will impair current bullish cycle. Even then, this may not be a clear bearish sign though, as there is no point of reference in recent history to justify a stoch topping around current levels. As such, we will need to see prices clearing either 1.325 or 1.326 before meting out judgement on further short-term direction.
Weekly Chart
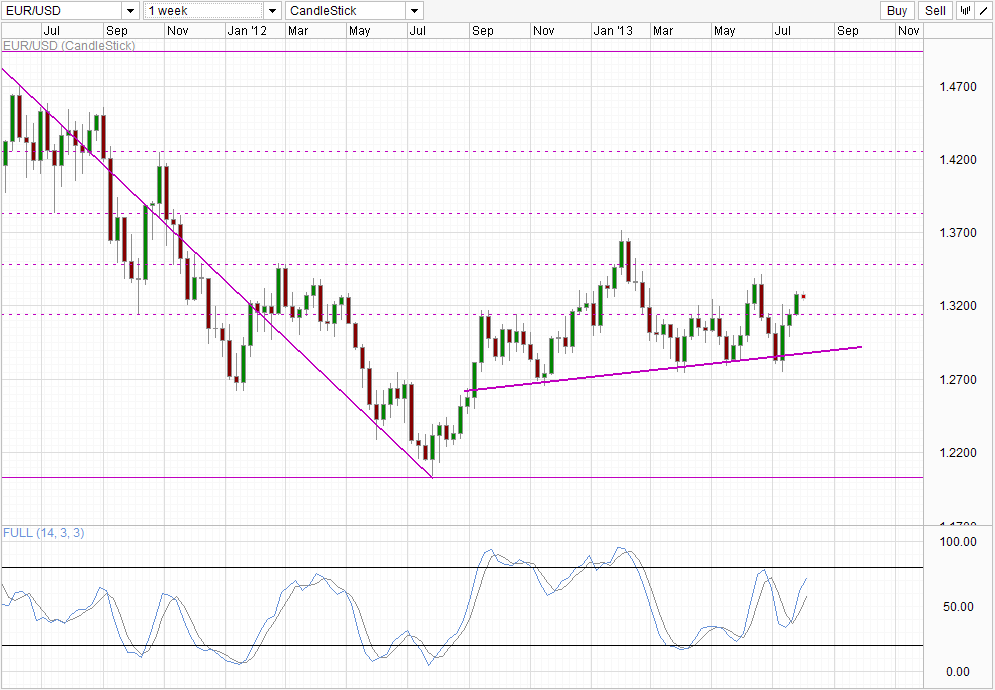
It is kind of infuriating to see that the Head and Shoulders pattern is getting nowhere. Following the breach of 1.315 last week, the H&S pattern is already being heavily impaired, but the bullish follow through leave much to be desired, suggesting that we could find ourselves in a situation similar to June, where the push above 1.315 and 38.2% Fib retracement was followed by a swift move back lower. Stochastic readings are still generally bullish, with readings pointing higher and generally a fair distance away from Overbought regions. Furthermore, looking at the historical readings, one can argue that the uptrend from April’s rebound has never truly ended. This puts bulls in a good position to push to the 50.0% Fib retracement, and allow price to potentially extend the rally that has started since July 2012. However, if price continue to trade lower and breaches 1.315, we may see more sideways action between the rising trendline and 1.315 once again, which is highly frustrating for trend traders seeking stronger directional conviction.
More Links:
USD/CAD – Unchanged as US Posts Weak Housing Numbers
GBP/USD – Pound Loses Ground Despite Strong UK Sales Numbers
USD/JPY – Solid Japanese Retail Sales Pushes Yen Higher
This article is for general information purposes only. It is not investment advice or a solution to buy or sell securities. Opinions are the authors; not necessarily that of OANDA Corporation or any of its affiliates, subsidiaries, officers or directors. Leveraged trading is high risk and not suitable for all. You could lose all of your deposited funds.

Mingze Wu
Latest posts by Mingze Wu (see all)
- European Bourses Not Enjoying Bullish Winds From US Stocks - 17 April 2014
- More Aggressive Stimulus Possible Despite Premier Li’s Denial - 17 April 2014
- China March FDI -1.5% Y/Y vs +2.05% expected. First decline in more than a year. - 16 April 2014