Hourly Chart
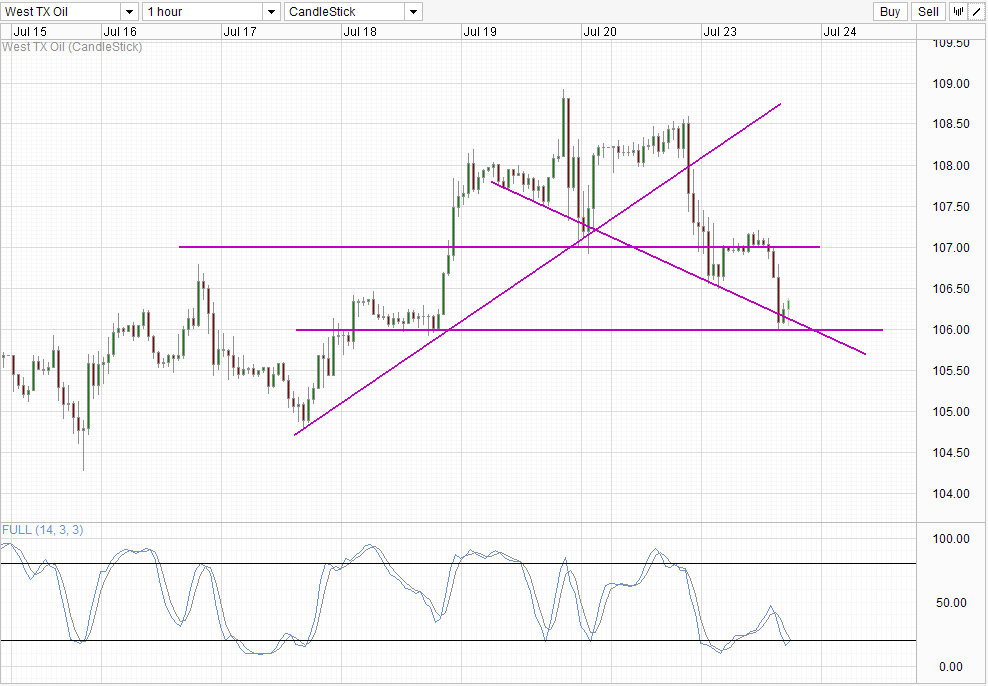
Crude Oil stumbled once more yesterday, falling hard after touching 108.50 briefly during early US session. Price took another dip today, failing to hold onto the 107.0 handle, finding support around round number 106.0. which was acting as the ceiling for price between 10th – 17th July. The fundamental reasons for the decline isn’t apparent currently, with broad risk appetite of market actually positive. There wasn’t any inventory data being released either, and political situations in middle east remained the same as well. Hence we are forced to consider that the decline may be catalyzed by technical bears seeking to fade the rally.
If the above assertion is correct, then perhaps the likelihood of price holding 106.0 becomes that much higher. Stochastic readings currently are Oversold, and looks likely to push higher to signal a bullish cycle. This would open up 107.0 as plausible bullish target and potentially trade above 107.0 to reestablish the previous bullish pressure that was lost from the 107.0 breach. However, it is worth noting that Stochastic setup looks fairly similar back at 107.0, and price similarly bounced from the descending trendline only to see a bearish rejection confirmed off 107.0. Furthermore, if stoch readings does rebound higher from here, the stoch trough would actually be higher than the one formed towards the end of US session. This divergence between price and stoch action would imply that the resultant bullish signal is impaired, hence still favoring downside.
With data from American Petroleum Institute coming out today, we may see some technical bears closing up their positions temporary and avoid the event risk. This may explain in part current rebound, and again supports the assertion above that the rebound may be temporary. Should implied demand meet or comes below expectation, we could see even stronger selling pressure following the event. In the event that implied demand is higher than expected, it is likely that WTI may rally towards 107.0. Should that happen, keep a look out on price action around the resistance level – any sign of bearish rejection around 107.0 will be a confirmation that technical bears are still in charge, and we could continue to see similar activities tomorrow until the Department of Energy numbers are out.
More Links:
Gold Technicals – 1,330 Breached as Rally Continues
EUR/USD – Pushes Towards Resistance at 1.32
AUD/USD – Moves Through 0.92 with the Resistance at 0.93 Looming Large
This article is for general information purposes only. It is not investment advice or a solution to buy or sell securities. Opinions are the authors; not necessarily that of OANDA Corporation or any of its affiliates, subsidiaries, officers or directors. Leveraged trading is high risk and not suitable for all. You could lose all of your deposited funds.

Mingze Wu
Latest posts by Mingze Wu (see all)
- European Bourses Not Enjoying Bullish Winds From US Stocks - 17 April 2014
- More Aggressive Stimulus Possible Despite Premier Li’s Denial - 17 April 2014
- China March FDI -1.5% Y/Y vs +2.05% expected. First decline in more than a year. - 16 April 2014