Topsy-turvy morning for AUD/USD as 2 major news were released. First up we have Q2 Australia CPI results which was a mixed bag. Prior to the release of the CPI numbers, DJ Polls showed that market expected headline inflation rate to be 0.5% Q/Q and 2.5% Y/Y. Bias was already on the downside due to RBA saying last week that tame inflation provides the Central Bank scope to cut policy rates further. Hence even if CPI numbers meet expectations, traders would be willing to sell as this would not change RBA’s earlier assertion. Hence it is no surprise that selling pressure grew immensely when the headline CPI numbers came in slightly below expectations. Q/Q came in 0.4% while Y/Y stood at 2.4%, both 10 bps lower than expected. Prices dived towards 0.9246 within 1 minute, as bears jumped on the bandwagon to sell, expecting an even higher likelihood of RBA rate cuts on 6th August.
However, the rest of the inflation numbers weren’t uniformly lower than expected. RBA Trimmed Mean came in at 0.5% Q/Q, meeting expectations, while Y/Y came in at 2.2%, 10 bps higher than expected. The previous quarter’s numbers have also been revised higher, making the unexpected gain all the more impressive. RBA Weighted Median numbers did even better, coming in 20 bps higher than expected for both Q/Q and Y/Y figures, coming in at 0.7% and 2.6% respectively. Market decided to place more weight on the peripheral numbers, buying back AUD/USD quickly and driving price above 0.93 for the 1st time since 11th July.
If that quick turnaround wasn’t enough, price dipped back towards the post CPI lows 15 mins later due to a lower than expected print from HSBC Flash Manufacturing PMI, which came in at 47.7 vs 48.2 expected, marking the worst print in 11 months at the same time. This is yet another month of shrinkage in China’s manufacturing sector, making it the 3rd consecutive shrinkage in a row, and the 4th consecutive month which the print has fallen below analysts estimate. Despite the fact that shrinkage in China’s economy has been widely expected and documented, it seems that the pace of slowdown has been increasing, and not stabilizing based on data seen from Jan 2013. Interestingly, we have China’s Development Research Center releasing a statement yesterday saying that Chinese economy has became unstable and uncertain “like never before”. The DRC is the direct advisory agency for Chinese Ministers, and hence we should not take their words lightly.
A weaker Chinese Manufacturing sector will almost certainly result in a reduce intake of raw commodity, which is the main driver of Australia’s economy currently. Hence it is not surprising to see traders pushing back AUD/USD back down, hitting 0.92463, a mere 0.3 pip higher than the CPI data low.
Hourly Chart
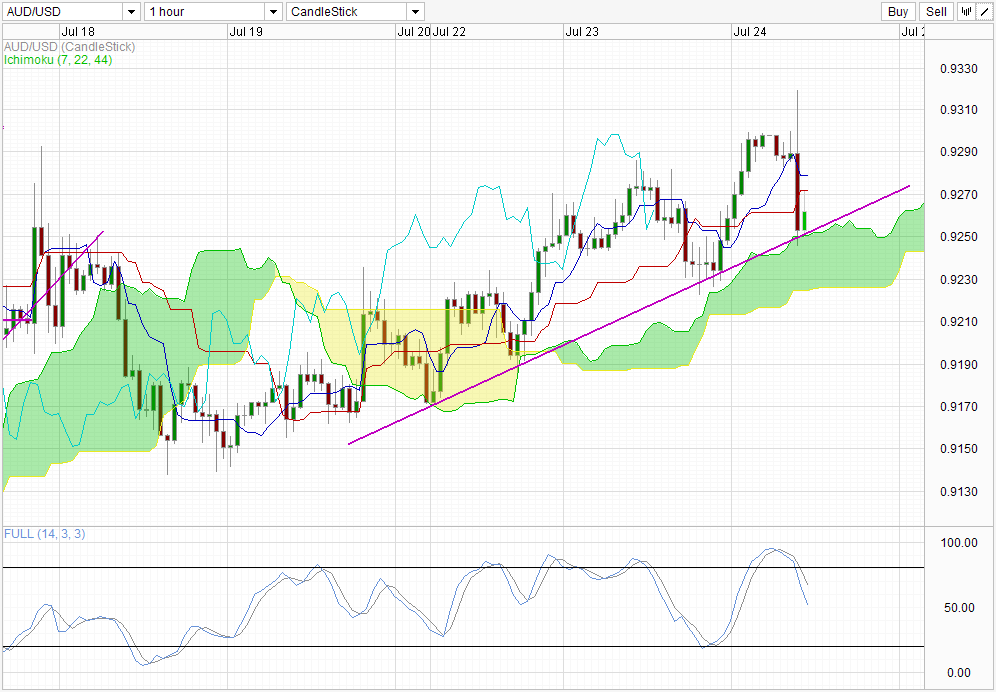
Since then, price has stabilized above 0.925, with most of the price action staying between 0.926/0.927. From a technical perspective, this is a rebound from the rising trendline which has been supporting this week’s rally, which happens to be the confluence with current Ichimomu Senkou Span A (Kumo Top). With this rebound, the uptrend that has started from last Friday remains in play, and a move back towards 0.93 remains possible.
However, downside risks remains from a technical viewpoint. Stoch curves suggest that we are currently in a bear trend, and should price break below the trendline, we will be trading within the Kumo. Though price action within Kumo tends to suggest uncertainty, and could go either way, the flatter nature of Senkou Span B (Kumo Bottom) allows it slightly higher magnetism to draw price lower. Furthermore, trading around the Senkou Span B will not necessary negate this week uptrend either, and hence may be a good foothold for bulls to rest before retaking 0.93 once more. In the event of a break, 0.919/0.92 will be the next level of support and final bearish target would be 0.915 in a single strong bearish momentum.
Daily Chart
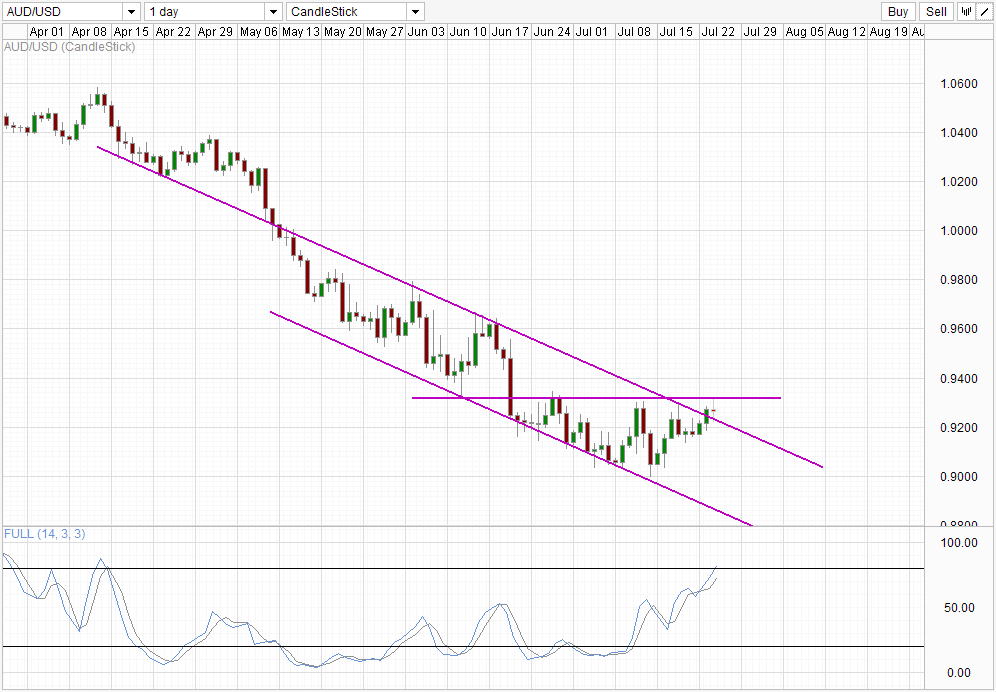
Long term chart is also slightly mixed. Though price is above to break away from the descending Channel, the failure to trade above 0.93 consistently suggest that a fakeout may be in play. With the daily candle closing soon (12:00am EDT close), we are likely to see a Doji candlestick formed. This does not necessary mean that a bearish reversal is coming, but with Stochastic readings reaching Overbought, and given the overall long-term bearish trend, long-term momentum favors a move back towards the channel. Should the next candle proved to be a bearish one and enters Channel once more (Channel Top around 0.92), we could potentially see bearish acceleration towards Channel Bottom in the days to come.
More Links:
GBP/USD – Places Pressure on 1.54
EUR/USD – Continues the Push Through 1.32 to One Month High
AUD/USD – Continues to Place Pressure on Resistance Level at 0.93
This article is for general information purposes only. It is not investment advice or a solution to buy or sell securities. Opinions are the authors; not necessarily that of OANDA Corporation or any of its affiliates, subsidiaries, officers or directors. Leveraged trading is high risk and not suitable for all. You could lose all of your deposited funds.

Mingze Wu
Latest posts by Mingze Wu (see all)
- European Bourses Not Enjoying Bullish Winds From US Stocks - 17 April 2014
- More Aggressive Stimulus Possible Despite Premier Li’s Denial - 17 April 2014
- China March FDI -1.5% Y/Y vs +2.05% expected. First decline in more than a year. - 16 April 2014