USD/JPY traded sharply lower this morning, falling from a high of 100.50 to 99.80 within the first few hours of trading this morning. Prices mimicked the price action of Nikkei 225 Futures, which traded sharply lower today. The reason for the decline could be similar to N225 – Shinzo Abe’s party majority victory allows him to have free reign in whatever he wants to do, and hence there is less incentive for him to stick firm to his Abenomics plans and start to introduce unpopular policies take for example the Sales Tax hike. It seems that the Government is quick on the iron, saying that they will debate on the Sales Tax Hike decision in Autumn, just 1 day after winning the majority seats of Japanese upper house. Or perhaps, USD/JPY is simply trading lower due to correlation to Nikkei 225, with the sell-off in N225 triggering risk aversion trends and hence pushing Yen stronger. There is some credence to this theory, considering that AUD/USD, EUR/USD and other risk correlated assets traded lower during early Monday session, while Gold – anti risk asset traded higher.
Hourly Chart
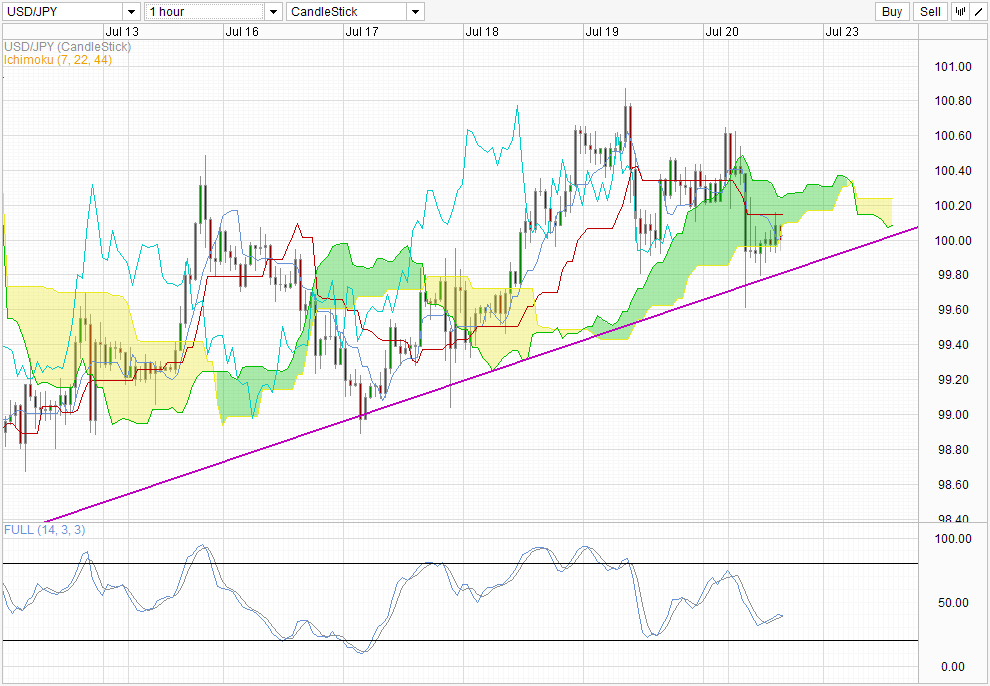
From a technical point of view, price managed to find some support via the rising trendline after breaching below the Kumo. Currently price is straddling the Senkou Span B (Kumo Bottom) moving higher, but that can hardly be construed to be bullish. Without breaking current Kumo to the upside, the Kumo will more likely provide overhead resistance rather than help prices trade higher. Furthermore, forward Kumo shows a bearish Kumo Twist, and though stochastic readings are currently pointing marginally higher, it should be noted the readings did not tag the Oversold region before pushing up, hence the bearish cycle that has been in play cannot be invalidated. As we are trading below 100.0, the possibility for a move back towards the rising trendline becomes a higher possibility, and increases the likelihood of price breaking the trendline.
Daily Chart
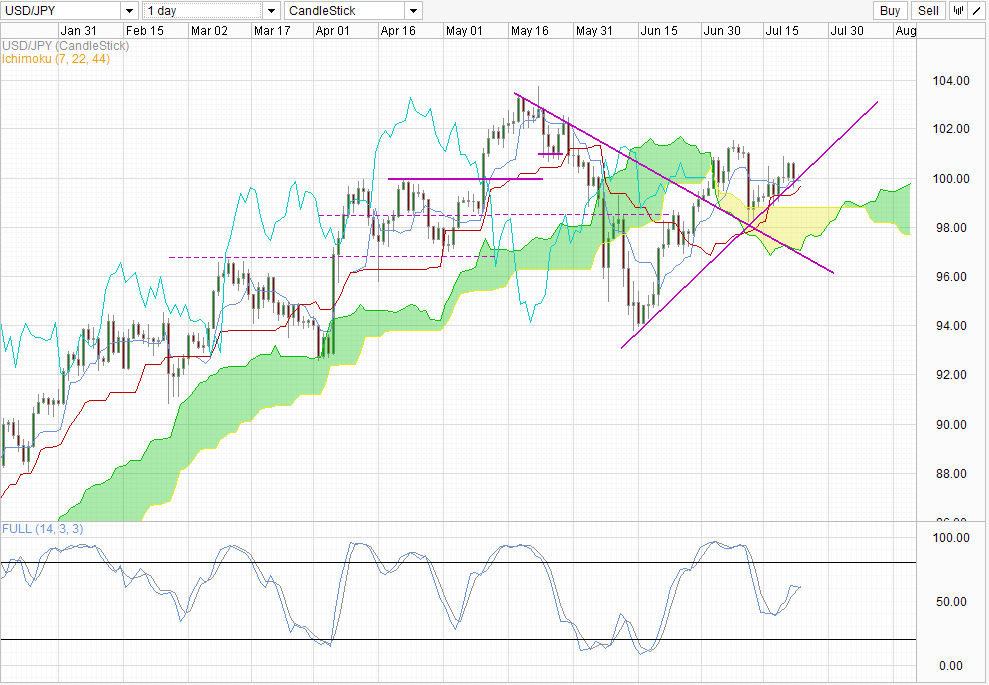
Daily Chart is much less bearish, with readings actually bouncing higher from the Senkou Span B and currently straddling the rising trendline. Forward Kumo is also bullish, which suggest that price is currently on an uptrend with July’s previous swing high and May Highs as possible bullish targets. However, Stochastic readings from Daily Chart suffer the same issue as the Hourly Chart’s – Current bullish cycle indicated by stoch readings is not a strong one, and looks more like a temporary pullback cycle amidst a bearish cycle which has not ended yet. Should the break of 100.0 is confirmed, we could potentially see acceleration back towards Senkou Span B which may provide support which it has done so previously.
More Links:
GBP/USD – Rallies Well Towards 1.53
AUD/USD – Continues to Place Pressure on Resistance at 0.92
EUR/USD – Continues to Feel Comfortable Above Support at 1.31
This article is for general information purposes only. It is not investment advice or a solution to buy or sell securities. Opinions are the authors; not necessarily that of OANDA Corporation or any of its affiliates, subsidiaries, officers or directors. Leveraged trading is high risk and not suitable for all. You could lose all of your deposited funds.

Mingze Wu
Latest posts by Mingze Wu (see all)
- European Bourses Not Enjoying Bullish Winds From US Stocks - 17 April 2014
- More Aggressive Stimulus Possible Despite Premier Li’s Denial - 17 April 2014
- China March FDI -1.5% Y/Y vs +2.05% expected. First decline in more than a year. - 16 April 2014