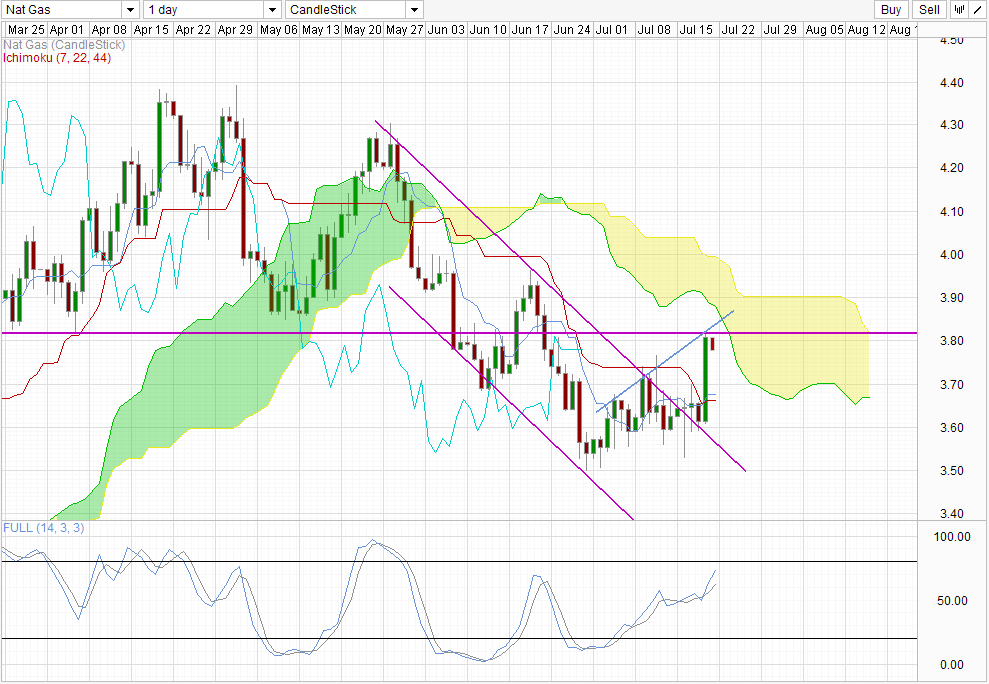
The “Widow Maker” has been heading lower since Mid April, forming lower lows and lower highs, pushing price from a high of 4.39 to 3.50 in a span of 2.5 months. Currently we’re in the midst of a bullish recovery rally that started from 29/30th June. Despite price breaking above the descending channel, the sequence of lower lows and lower highs is still not broken. Furthermore, yesterday’s rally simply led price to the intersection point between 3.82 significant support turned resistance and the rising trendline that act as the ceiling for the rally since the June lows. Besides the aforementioned trendline, there are further overhead pressure coming in the form of descending Kumo, standing just . Even though Stochastic readings are still pointing higher, readings are currently above the peak seen back in June, but price is definitely lower than the June peak, with the divergence suggesting that it will not be surprising should Stochastic readings head lower from here despite not entering Overbought region. All in all, it is hard to say that price has turned a bullish corner based on technical. Perhaps we may be more generous should price clear 3.82 first, and preferably above 3.90 and stay above the descending Kumo.
Daily Chart
What about the fundamentals?
Latest data from Energy Information Administration showed that US gas inventories rose by 58 billion cubic feet – below the consensus estimate of 64 BCF. However, unlike Crude Oil which has seen 3 consecutive weeks of missing estimates, Natural Gas numbers has seen more bearish numbers than bullish in recent weeks. The last bullish sequence of consecutive weeks of higher implied demand was in April, where price has peaked in 2013. The increase in implied demand this week is also not the strongest that we’ve seen far, and would have been overstated by the strong long candle that we see yesterday. Perhaps the increase in risk appetite yesterday has aided price to push up higher than it should, and if that is true, then we should not expect price to continue rally for long as Nat Gas correlation to risk trends tended to be much weaker compared to Crude Oil and other energy products.That being said, should EID data enters a purple patch similar to the one that we’ve seen back in April, bulls will be in a much better position to clear the 3.90 level and hopefully sustain above it to potentially bring us closer to 4.39 in 2H 2013.
More Links:
USD/JPY – Loose Lips Sinks Ships as 100.0 Threatened
Nikkei 225 – Breaking below Kumo on Hamada Comments
GBP/USD – Maintains Push Through 1.52
This article is for general information purposes only. It is not investment advice or a solution to buy or sell securities. Opinions are the authors; not necessarily that of OANDA Corporation or any of its affiliates, subsidiaries, officers or directors. Leveraged trading is high risk and not suitable for all. You could lose all of your deposited funds.

Mingze Wu
Latest posts by Mingze Wu (see all)
- European Bourses Not Enjoying Bullish Winds From US Stocks - 17 April 2014
- More Aggressive Stimulus Possible Despite Premier Li’s Denial - 17 April 2014
- China March FDI -1.5% Y/Y vs +2.05% expected. First decline in more than a year. - 16 April 2014