Oil prices has failed to stay above 106.50 again yesterday, with price peaking at 106.78 but traded lower quickly after that. This decline occurred in spite of the American Petroleum Institute weekly report which showed that demand in Oil continue to remain strong. Crude-Oil inventories showed a decline of 2.6 million barrels last week. However, if we look at S&P 500 and Dow 30, we would notice that the decline in Crude is echoed with the decline seen in both equity indexes, showing that the reason for last night’s decline and current sell-off is related to the evaporation of risk appetite. For today’s Department of Energy report, analysts expect a decline of 2.2 million barrels in crude oil inventories. Should the decline be less than expected, it is possible that a quick bearish acceleration may occur given current risk appetite backdrop. US Futures are currently trading lower, suggesting that Crude already has a higher predisposition to trade lower with US market expected to be bearish today before Bernanke speaks at 2:00pm EDT. Post Bernanke’s speech may provide a different backdrop, but as the DOE report comes out almost 4 hours before Bernanke’s scheduled appearance, it is likely bears may already have their way should numbers disappoint before Bernanke can save the day.
Hourly Chart
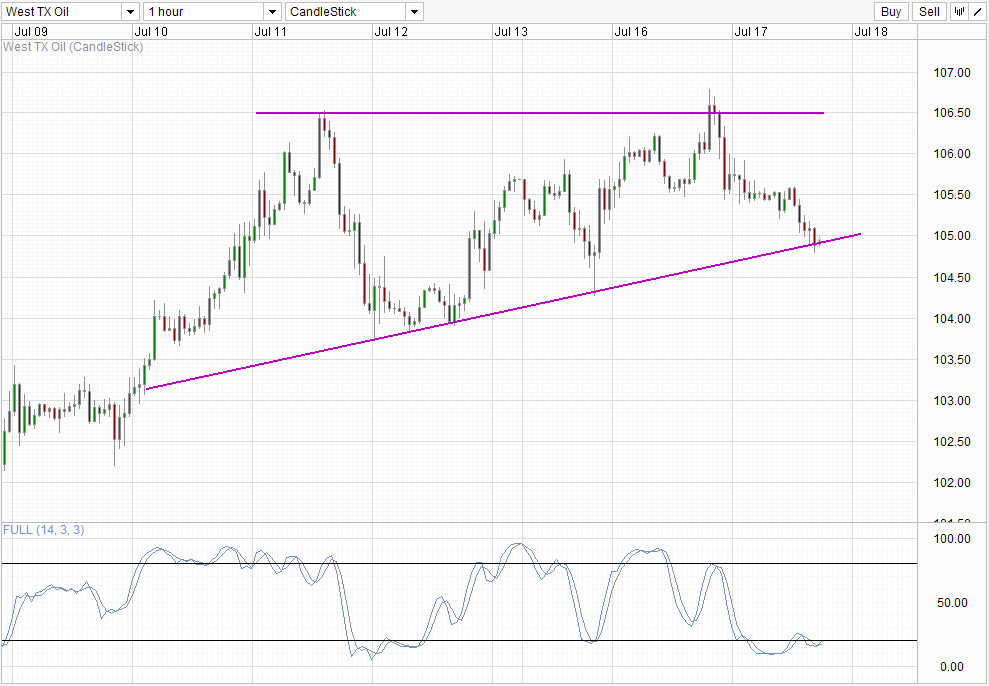
From a technical perspective, price is currently trading just around the rising trendline that has been supporting the break of 103.5 ceiling. A break of this rising trendline exposes 104.0 floor once again, with 104.5 soft support in the interim. Stochastic however support a rebound scenario with Stoch readings trying to push above 20.0 to signal a bull cycle. Should 105.0 holds, the likelihood of a rebound towards 106.5 increases especially if 105.5 is broken.
Daily Chart
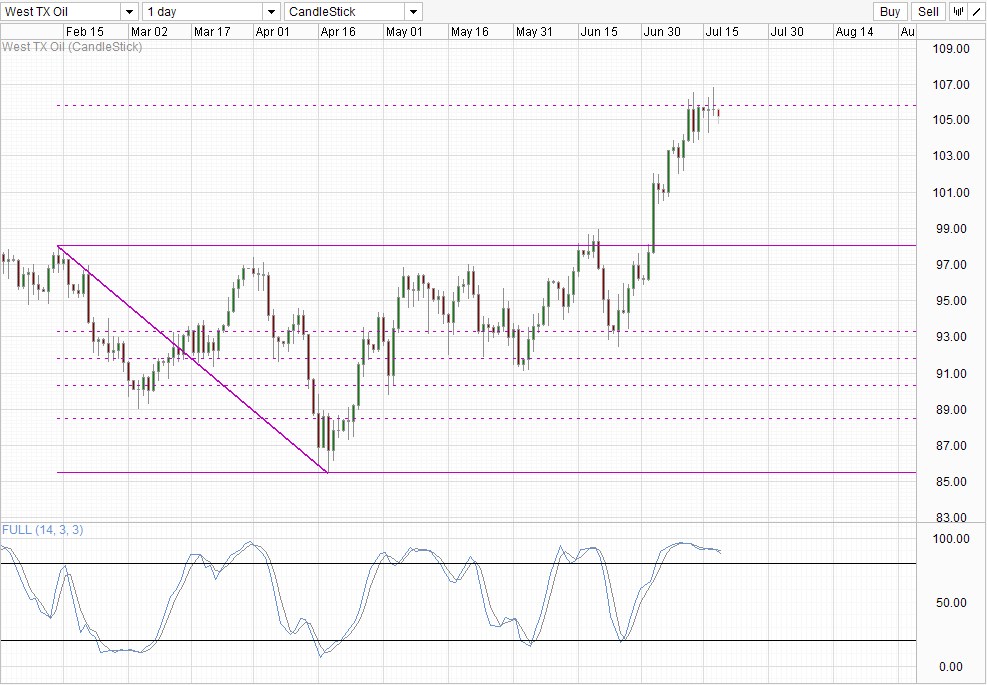
Daily Chart shows that price has been consolidating around 103.5 – 106.0, just under the 161.8% Fib Extension taken from the decline of Feb’s high to April’s low. This range happens to be the long-term consolidation range seen from Aug 2012 – June 2012, while current rally from 98.0 can be regarded as an breakout “extension” of this consolidation range. If this may seem frivolous, traders may also wish to take reference from consolidation tops found in April-May of 2011, and Mar-April 2012, both of whose floor are providing strong resistance reference for current bull run. Regardless of your preference, 106 upwards to 110 can be considered as a strong resistance band where prices tend to top in the past few years. Stochastic readings are also favoring downside for now, with readings pointing lower but a bear cycle signal is not there yet, with readings not yet breaking 80.0. It is likely that 80.0 will only be breached should price break below 103.5, which may then usher in a stronger correction back towards 98.0.
Fundamentally, the global recession looks likely to continue for a while more, and hence we should not truly expect demand of oil globally to increase significantly from here. The reason WTI Crude has been rising can be attributed to the better supply line thanks to the pipelines in Cushing OK. This explains the reason why Brent Oil still remain depressed and far from 2013 highs despite a recent rally most likely attributable to seasonality and the Middle Eastern turmoil. The lack of fundamental support suggest that current bullish acceleration of WTI may evaporate fast, in line with the potential bearish setups seen in short-term and long-term charts.
More Links:
GBP/USD – Continues to Sit on 1.51
AUD/USD – Surges Back Above 0.92
EUR/USD – Pushes Through Resistance at 1.31
This article is for general information purposes only. It is not investment advice or a solution to buy or sell securities. Opinions are the authors; not necessarily that of OANDA Corporation or any of its affiliates, subsidiaries, officers or directors. Leveraged trading is high risk and not suitable for all. You could lose all of your deposited funds.

Mingze Wu
Latest posts by Mingze Wu (see all)
- European Bourses Not Enjoying Bullish Winds From US Stocks - 17 April 2014
- More Aggressive Stimulus Possible Despite Premier Li’s Denial - 17 April 2014
- China March FDI -1.5% Y/Y vs +2.05% expected. First decline in more than a year. - 16 April 2014