So the bears have spoken – AUD/USD tanked spectacularly after hitting the 0.93 resistance yesterday. Price rallied from the low of 0.910 due to Bernanke’s dovish talk on Wednesday, which sent USD weaker and AUD/USD much higher. However, it is clear that USD weakness is no match for bearish sentiment surrounding AUD, with expectations for RBA rate cut in August increasing by the day. Today added further scope for potential RBA rate cut, with the latest Home Loans data coming in at 1.8% vs an expected 2.2%, suggesting that the housing market will have a lower risk of bubbling should RBA cut rate again. Not that RBA will need this extra scope, as they have been repeating ad nauseam in every single rate meeting that current inflation rate/expectation allow RBA to cut rates if they wanted to.
Some may say that the decline yesterday was due to the strengthening of USD following strong showing of US stocks which led to record S&P 500 close. That is only partially accurate though, as it is clear that bearish sentiment in AUD is stronger than other risk currencies when we look at EUR/USD and GBP/USD, where the pullback wasn’t as strong as AUD/USD, with price barely giving up 50% of the gains made post FOMC minutes. The fact that the huge turnaround started from 0.93 significant resistance suggest that there are huge predatory bears looking for good opportunities to sell at key price points, with the rest of the opportunistic speculators helping to push price lower to where we are now.
Hourly Chart
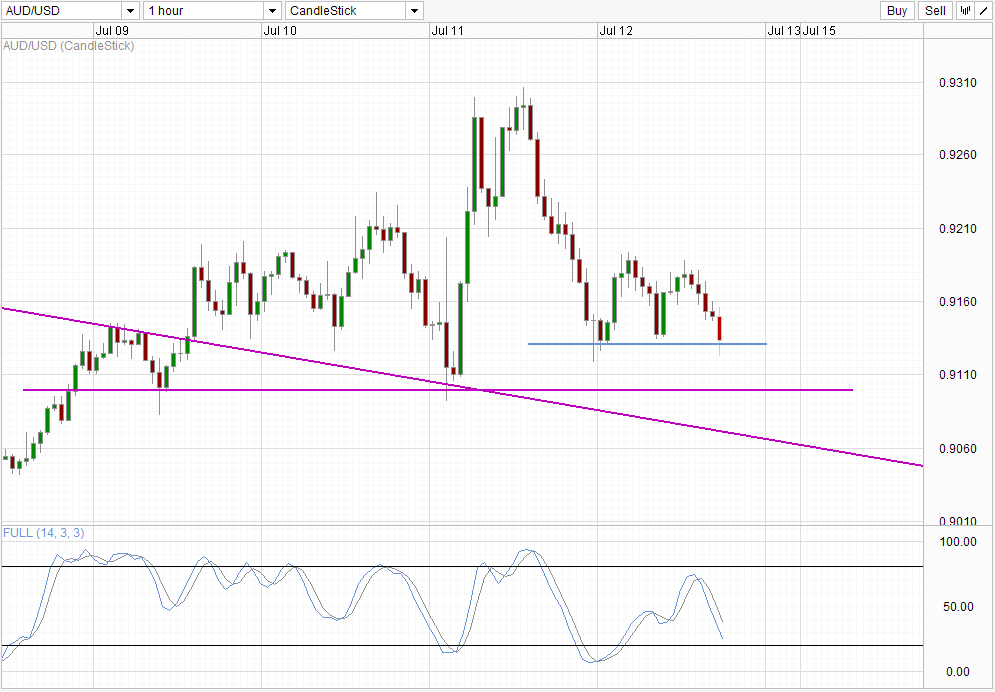
Currently, we are being supported by the intraday support of 0.913. Given the strong bearish pressure that was described above, and the fact that stochastic readings are still above the Oversold region, it is possible that price may be able to break the weak intraday support to find stronger support around 0.910 and potentially the descending trendline.
Daily Chart
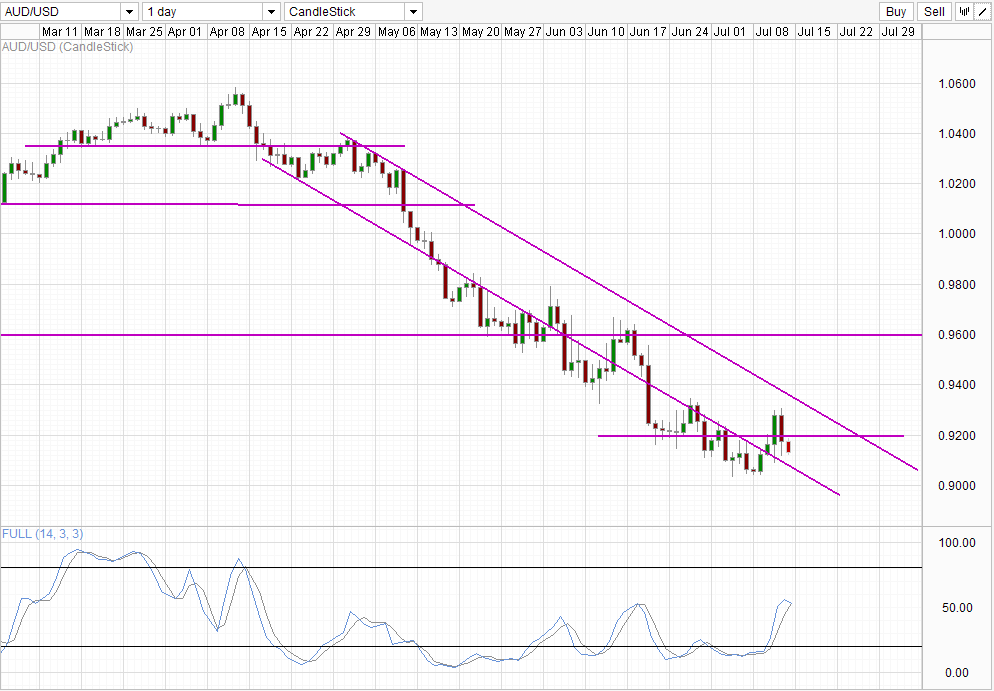
Looking at price action from the Daily Chart perspective, we can’t really say that we’re surprised that a tweezer top has formed. Price has failed to hit Channel Top ever since May and the previous 2 attempts to break within the Channel has failed miserably. Looking at how price has reacted in the past, Channel Bottom does not really provide support for price action, with price breaking below the Channel Bottom with ease, and only using the line for resistance reference. With this in mind, do not be surprise to see price breaking below Channel Bottom especially since a reversal pattern has been formed. Furthermore, Stochastic readings suggest that a bear cycle may be forming soon with Stoch lines looking to close below the Signal line. Considering that there is a divergence between Price peaks and recent higher stock peaks, this bearish cycle signal may be strong as it implies that recent rally activities have been much more overbought compared to before.
More Links:
EUR/USD Technicals – H&S Breakout Foiled
USD/SGD – SGD Weaker Despite Stronger GDP
USD/JPY – Yen Soars as Federal Reserve Split over QE
This article is for general information purposes only. It is not investment advice or a solution to buy or sell securities. Opinions are the authors; not necessarily that of OANDA Corporation or any of its affiliates, subsidiaries, officers or directors. Leveraged trading is high risk and not suitable for all. You could lose all of your deposited funds.

Mingze Wu
Latest posts by Mingze Wu (see all)
- European Bourses Not Enjoying Bullish Winds From US Stocks - 17 April 2014
- More Aggressive Stimulus Possible Despite Premier Li’s Denial - 17 April 2014
- China March FDI -1.5% Y/Y vs +2.05% expected. First decline in more than a year. - 16 April 2014