After clocking in a 6th consecutive day of gains, S&P 500 finally set a record finish, closing at 1,675.02, almost 6 points above the previous record set on 21st May 2013. For those not following US stock markets for some time would wonder what is the big deal, considering that 2 months have not even passed since the previous high – which suggest that current new high is part of the previous rally. Furthermore, we are only less than 6 points above the previous record close, and not say 1 full percentage point higher, suggesting that price is just stumbling across the line, and not roaring across due to a surprise bullish impetus – again suggesting that this is merely an extension of the previous record finish, rather than a fresh bull trend.
However, if you have been following prices in US, you would have noticed that price has been extremely bearish ever since the previous high was made in May. Prices started declining steadily towards 1,600 due to speculation that Bernanke would , followed by a quick acceleration lower towards 1,550 when Ben Bernanke revealed potential plans for a QE tapering initiative. Hence, the current rally which led to a new S&P 500 record high is not the same rally that brought us the highs of 21st May. This rally also bring us out of the shadow from the previous QE3 tapering shadows, with the sell-off and the subsequent recovery showing that current rally may be perhaps more supported by fundamentals compared to before.
Nonetheless, it would be a lie to say that this is a flawless victory for the bulls. Unfortunately, current rally has been tainted by what Ben Bernanke revealed on Wednesday. Bernanke shock market once again, reiterating that stimulus measures are here to stay for the “foreseeable future”, and went further to say that current improvements in job creation and unemployment rate may be “overstating” the economy. Certainly this is a huge boost to prices, and a major catalyst that allowed S&P 500 to push above 1,650 resistance. But it is worth noting that current rally was already in play, since late Jun/early July, and hence it is reasonable to believe that prices would have been able to continue rallying without Bernanke’s assistance provided that fundamental data of US remain strong. On the technical side of things, it is also important to note that the record highs of Futures are yet to be matched (1,687.4) more than 10 points from yesterday’s Futures high of 1,676.2. Hence, do not expect prices to simply accelerate higher faster on a “bullish breakout”, because we are still far from it.
S&P 500 Hourly Chart
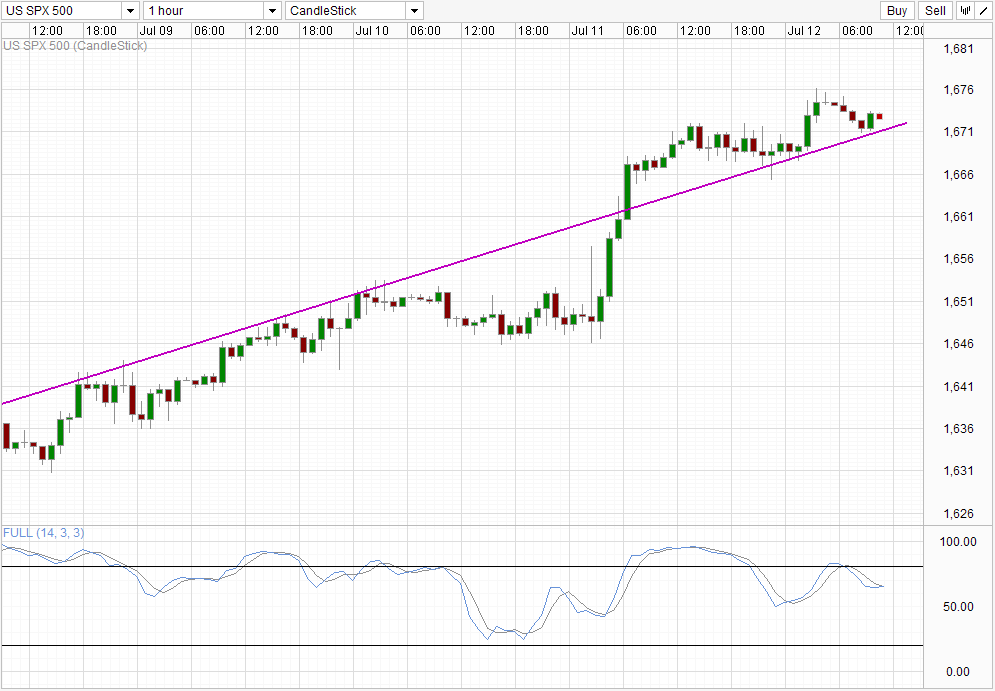
From a Technical perspective, we can see that the major bulk of bullish acceleration happened on Wednesday, with prices merely pushing slightly higher by the rising trendline. Stochastic readings suggest that a bear cycle is currently underway, but with Stoch lines flattening and looking likely to cross the Signal line, we are potentially seeing a trough forming – which will imply a return of the bullish cycle again. This potential bullish cycle signal should not be discounted as historical readings suggest that current levels tended to be the turning points for previous stoch curves. Also, looking at the recent preceding stoch troughs, there is no divergence between the steadily higher stoch troughs and price troughs, which suggest that a potential bullish signal may be reliable despite not forming after being Oversold.
Dow 30 Hourly Chart
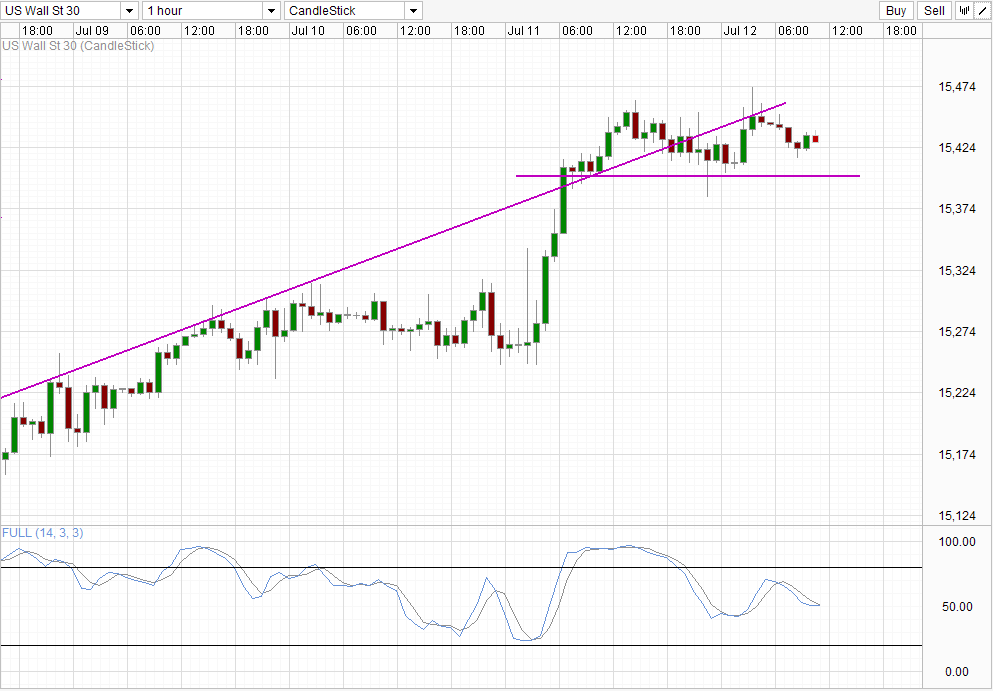
Dow 30 prices are a tad more bearish, as price is basically consolidating between the 15,400 – 15,450 range. We have also failed to stay above the rising trendline consistently, while stochastic readings for Dow 30 is also below the bulk of readings from 9th – 10th July, even though it is currently looking likely to form a Bullish Cycle signal.
With today being the final day of the week, it is less likely (not impossible) that prices may find more pullbacks as we’ve seen price going basically in one direction from Monday to Thursday. Should price continue to rally and send S&P 500 above 1,688, keep watch on Monday open for Stock Futures and see if there is a proper bullish acceleration from the “breakout”. Similarly, should price fall back significantly (S&P 500 under 1,665 and Dow under 15,400), see if bearish acceleration occur on Monday. A stronger technical signal will be formed if US stock futures move in a direction which make sense from a technical breakout perspective but appears to be countertrend to Asian risk appetite – E.g. S&P 500 rally on Monday morning following a break of 1,688 while Nikkei and HSI gap lower.
More Links:
AUD/USD – Aussie Unable to Consolidate Gains After Mixed Australian Employment Numbers
USD/JPY – Yen Soars as Federal Reserve Split over QE
EUR/USD – Euro Posts Huge Gains as Fed Split over QE Tapering
This article is for general information purposes only. It is not investment advice or a solution to buy or sell securities. Opinions are the authors; not necessarily that of OANDA Corporation or any of its affiliates, subsidiaries, officers or directors. Leveraged trading is high risk and not suitable for all. You could lose all of your deposited funds.

Mingze Wu
Latest posts by Mingze Wu (see all)
- European Bourses Not Enjoying Bullish Winds From US Stocks - 17 April 2014
- More Aggressive Stimulus Possible Despite Premier Li’s Denial - 17 April 2014
- China March FDI -1.5% Y/Y vs +2.05% expected. First decline in more than a year. - 16 April 2014