Traditionally, Bond Prices move in the opposite direction of Stock Prices. Should stock prices rise, bond prices will decline as market would want to exit lower yielding bonds and enter in higher yielding but comparatively riskier stocks. However, due to quantitative easing, this relationship as been heavily distorted, resulting in bond prices increasing in tandem with stock prices for the past few years. Nonetheless, with QE3 ending, we are starting to see the correlation of old returning.
Hence it is interesting to see that Bond prices are currently rallying despite US Stock futures pushing higher. Due to volatility, correlation between Bond/Stock is never a perfect -1. Hence this observation is not really anything special. However, such divergence movement tend not to be long lasting especially if we are unable to find any valid explanation for this sort of behavior (read more on Dow Theory for a deeper explanation on correlations). What this implies is that should Bond prices continue to trade higher with Stock prices (assuming ceteris paribus and Bernanke don’t recant on his QE3 tapering belief), we could potentially see a strong reversal in US stocks, or a strong reversal in Bond prices.
Daily Chart
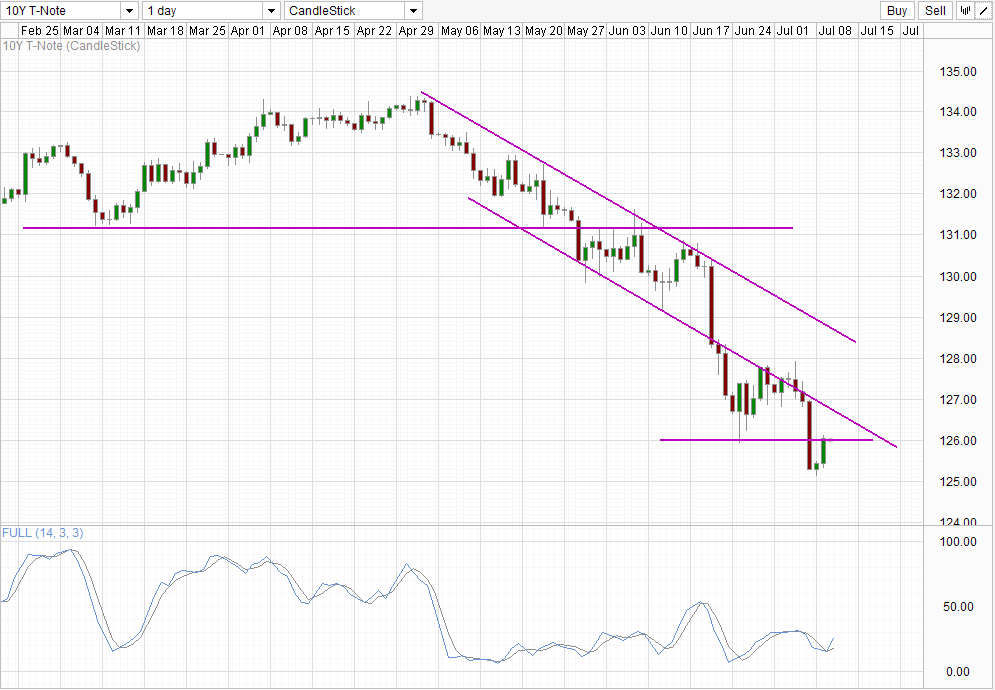
With that interpretation, and given 10Y falling prices and resistances in the form of 126.0 round figure/previous swing high and Channel Bottom, the chances of a bearish rejection for bond prices is higher. However, stochastic does not really agree, as readings are currently pointing higher and pushing above 20.0, suggesting that a bull cycle is currently underway. However, there remains a chance that current bull cycle may be stopped short, with previous stoch peak forming around the 50.0 mark. Should the situation indeed paned out this way, it will be in line with our previous assertion that prices should not be able to advance too far upwards given the overall bearishness and overhead resistances.
Hourly Chart
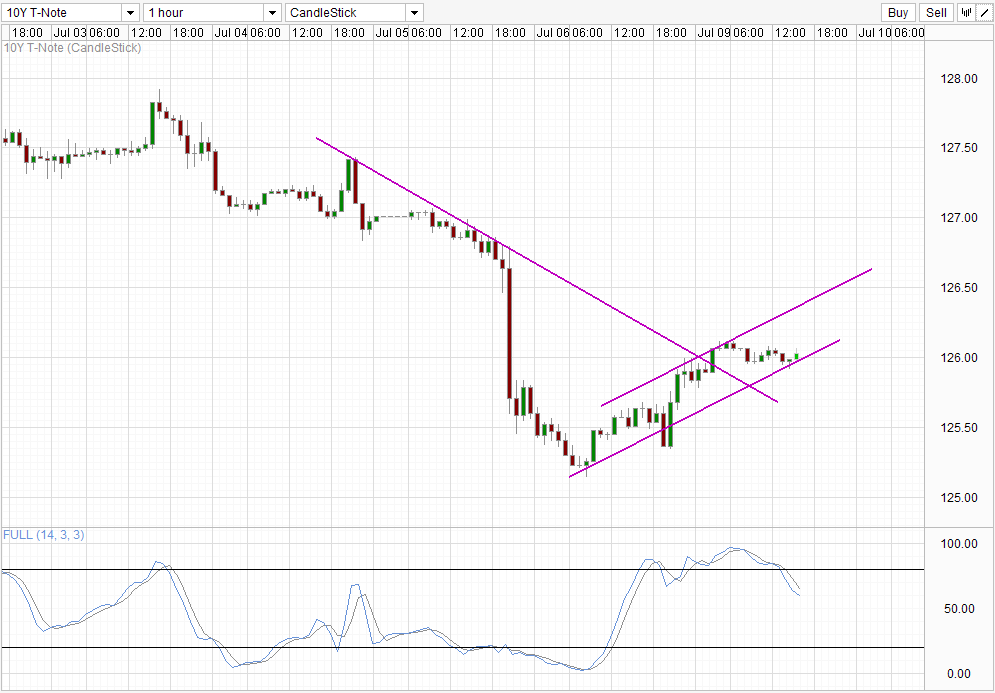
Bearishness is also observed from the short-term chart. Stochastic readings is signalling a bearish cycle that is underway. However, price is still currently sitting slightly above 126.0 and is finding support from the Channel Bottom. If the Channel Bottom support holds, it is possible that price may be able to seek Channel Top, but beyond that would be more difficult considering the long consolidation zone found around 127.0 which will provide resistance even if the Channel is broken.
More Links:
USD/SGD Technicals – Head and Shoulders Seen on Hourly
GBP/USD – Rallies Well to 1.4950
AUD/USD – Moves Back Above 0.91 in a Small Sign of Life
This article is for general information purposes only. It is not investment advice or a solution to buy or sell securities. Opinions are the authors; not necessarily that of OANDA Corporation or any of its affiliates, subsidiaries, officers or directors. Leveraged trading is high risk and not suitable for all. You could lose all of your deposited funds.

Mingze Wu
Latest posts by Mingze Wu (see all)
- European Bourses Not Enjoying Bullish Winds From US Stocks - 17 April 2014
- More Aggressive Stimulus Possible Despite Premier Li’s Denial - 17 April 2014
- China March FDI -1.5% Y/Y vs +2.05% expected. First decline in more than a year. - 16 April 2014