USD/JPY climbed higher on stronger USD yesterday, sending price above 100.0 for the first time since 6th June. JPY managed to maintain its weakness despite risk appetite coming off strongly during Asian session, but ultimately gave way to the immense bearish pressure during early European session – which saw European bourses gaping lower on the open.
Hourly Chart
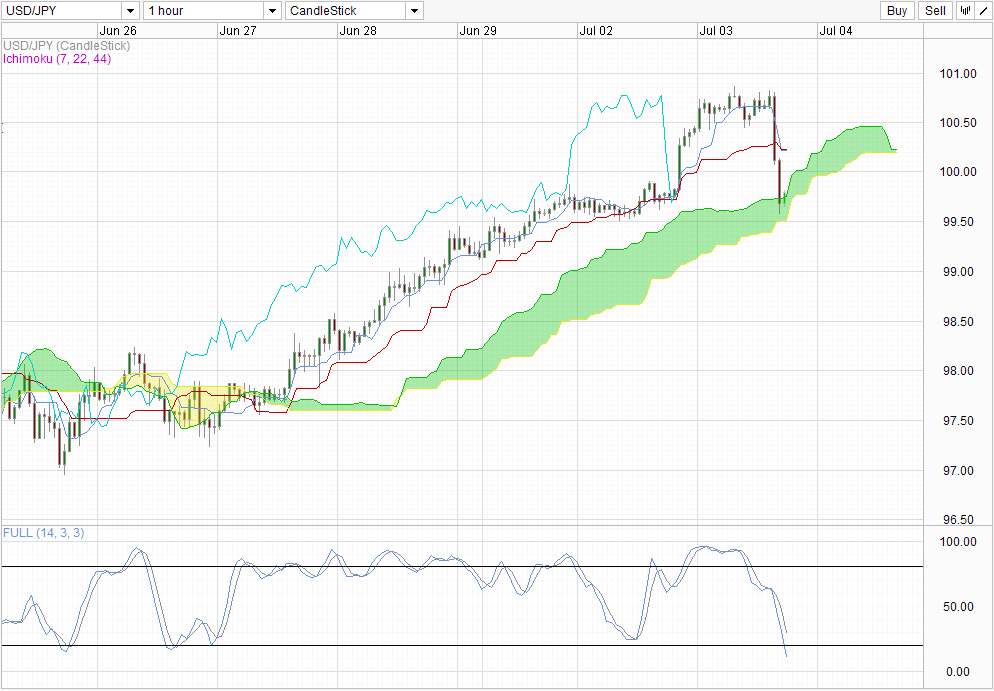
From a technical perspective, the quick sell-off once 100.5 is broken is not surprising as price went through similar speed on its way up. Furthermore, as the move higher wasn’t fundamentally supported, but appears to be fueled heavily by strong technical bulls looking for blood after a 100.0 breakout (not dissimilar to WTI Crude breaking 100.0). Currently price is finding support above 99.50, right in the middle of the consolidation range of 2nd July. On top of this, Ichimoku’s Kumo is also adding support, with current candle seeking to break back above after entering the Kumo.
This set ups USD/JPY positively, and suggest that a short-term swing back up once more. However, it is important to note that price should ideally clear 100.0 once again before further bullish objectives can be realistically reached. Currently, bulls are standing precariously with Kumo potentially forming a bearish twist. Furthermore, the thickness of Kumo does not really provide much support and it is possible that price may easily break current Kumo with a bearish Kumo breakout, which would also likely translate to a break of 99.50 with just a little bit of bearish push. Stochastic readings are continuing to point lower, and is just entering the Oversold region, suggesting that bearish momentum hasn’t really been broken especially since Signal line is still a fair distance away from being Oversold.
With ADP employment coming up later during US session, volatility in USD can be expected as this would be the first major employment data release since Ben Bernanke mentioned about the possibility of QE tapers. With that in mind, traders should be careful and ensure that a break/rebound of price from the Kumo is a result of proper sentiment/fundamental push and not mere volatility sending price above/below the Kumo. This is especially imperative considering the thinness of current Kumo.
Daily Chart
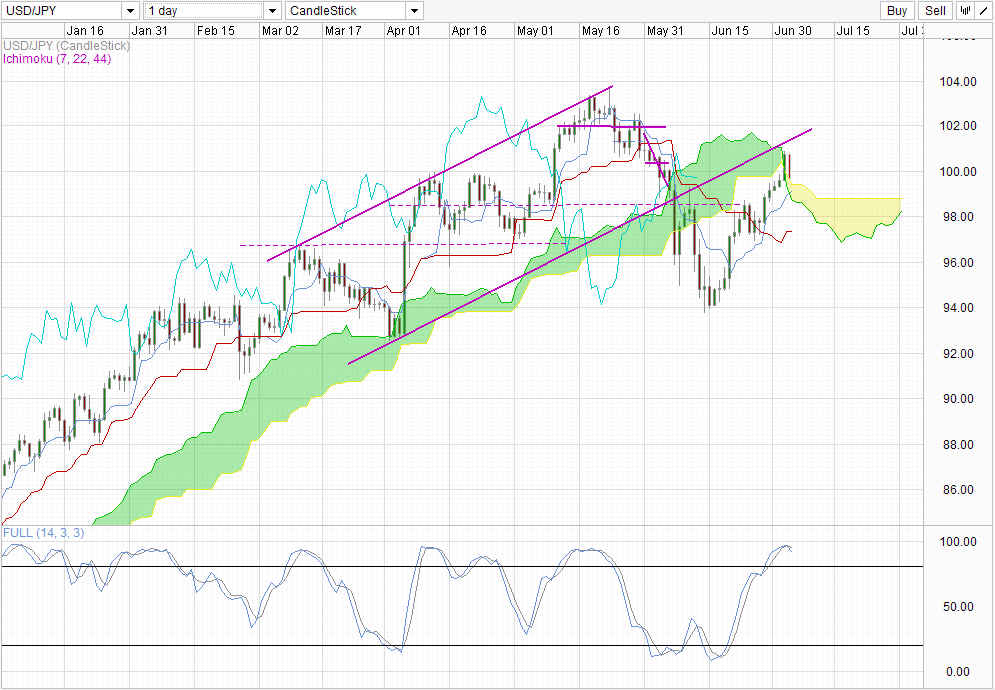
Price on the daily chart is more interesting. On one hand, one could argue that price is looking bearish due to the rejection of the ascending Channel, with price unable to test Channel bottom and fading lower. However, bulls would be able to argue the merits of price breaking current Kumo to the upside, with Senkou Span A and B narrowing and looking likely to “twist” to the bullish side even if price stay around current levels. Bears would then be able to point to the fact that Stochastic is starting to show signs of peaking as evidence that a bearish cycle is in play soon, but then bulls would be able point and say that the “rejection” is not correct as price did not even manage to test the trendline at all, and could move on to test it eventually if current bullish momentum continues.
The debate goes on and on without a clear victor, as such traders should be patient and continue to watch out for confirmations of sell/buy setups to be in play properly before jumping the gun. Looking from a broader perspective, it is worth noting that the uptrend of USD/JPY since Nov 2012 has not been invalidated with price still able to push for higher highs and higher lows despite the sell off since May. With the break of 98.5, the decline since May appears to be invalidated, allowing for the broad up trend to be in cruise control once again. However that being said, the lack of fundamental reasons for continued Yen weakness from here is disconcerting (BOJ is not doing anything more for now), and that may proved to be the Achilles heel for long-term bulls to break for fresh 2013 highs.
More Links:
US Market Roundup – Weaker Stocks on Stronger Factory Orders. ADP Next.
AUD/USD – Retail Sales Vs Trade Balance, Winner: RBA
EUR/USD Technicals – 1.30 breached, downside galore
This article is for general information purposes only. It is not investment advice or a solution to buy or sell securities. Opinions are the authors; not necessarily that of OANDA Corporation or any of its affiliates, subsidiaries, officers or directors. Leveraged trading is high risk and not suitable for all. You could lose all of your deposited funds.

Mingze Wu
Latest posts by Mingze Wu (see all)
- European Bourses Not Enjoying Bullish Winds From US Stocks - 17 April 2014
- More Aggressive Stimulus Possible Despite Premier Li’s Denial - 17 April 2014
- China March FDI -1.5% Y/Y vs +2.05% expected. First decline in more than a year. - 16 April 2014