EUR/USD started strongly on the 1st day of July trade, continuing the rebound from 1.30 which started last Friday. The rebound was brought about by stronger than expected Euro-Zone data, with both Italian and French Manufacturing PMI (Final) coming in stronger than previous estimates. The only let down was from Germany, which came in at 48.6, 0.1 point lower than the previous estimate of 48.7. However, even that was not able to dent the overall Euro-Zone composite PMI, which grew to 48.8 from 48.7. EUR/USD rallied strongly following the announcement, sending price towards 1.305 resistance but failed to break it. Bulls had a second wind 2 hours later will the release of Euro-Zone unemployment rate, which was also surprisingly better than expected – coming in at 12.1% vs an expected 12.3%. EUR/USD rallied once more, sending price back above 1.305, but alas bulls was still not able to conquer the resistance, with price heading lower, and only started pushing higher during US hours due to the weakening of USD.
Hourly Chart
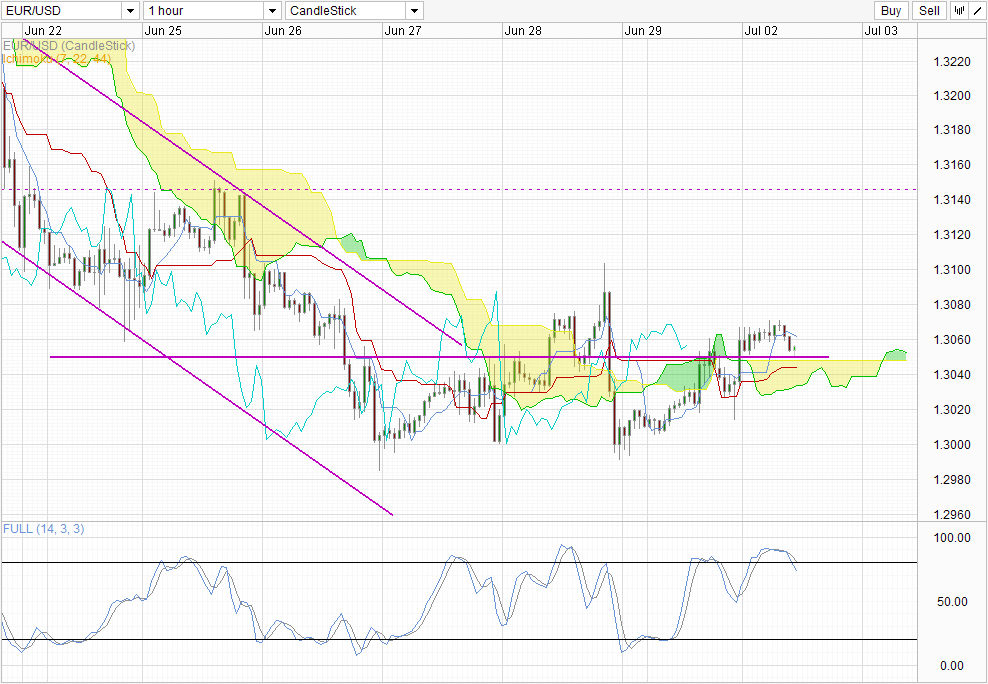
From a technical perspective, the rally during US hours is significant as it broke above the 1.305 and the confluence with Ichimoku’s Senkou Span B. This constitute a bullish Kumo breakout, and together with the bullish kumo twist places price in a good position to head higher towards 1.31. However, with the entire 1.305 – 1.31 price range currently acting as possible resistance zone, it is possible that price may not be able to even reach 1.31 before turning back. Stochastic readings agrees with such a scenario, with readings currently below 80.0 and Signal line following suit. A breach back below 1.305 and a bearish Kumo breakout would help to bring bias back to the bear side, which will open up 1.30 as a potential short-term bearish target once more.
Weekly Chart
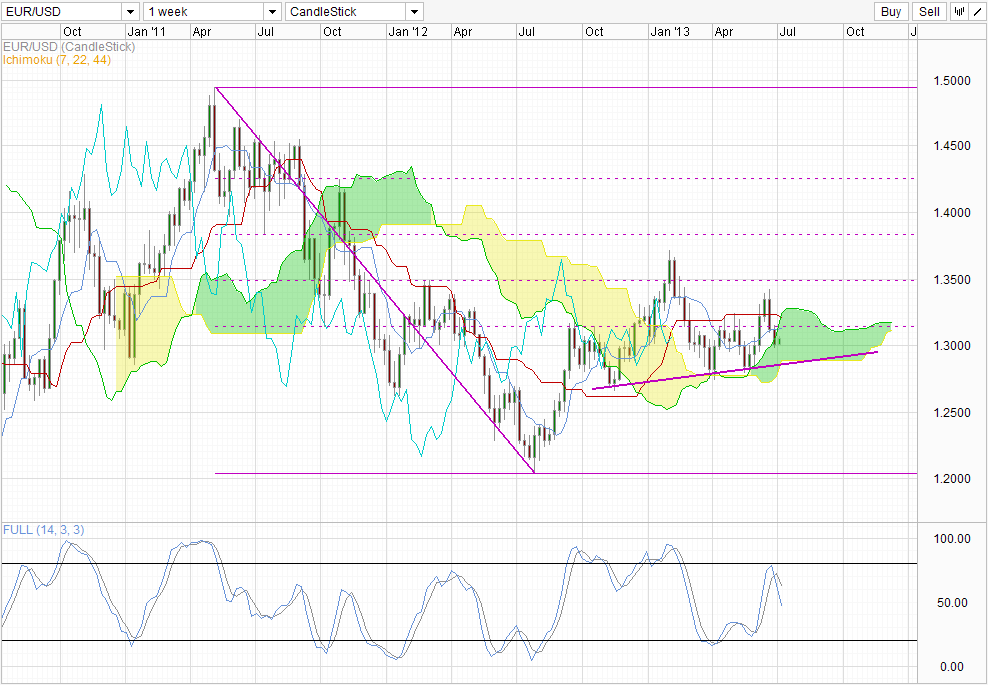
From the Weekly Chart, nothing much seems to have changed, and price is still currently lacking direction either way. Throwing Ichimoku indicator into the mix does not seem to provide another layer of insight, with Senkou Span B close to the potential Head and Shoulders neckline, while Senkou Span A currently intersecting the 50.0% Fib and 1.315 resistance. However, should price continue around this level, price would be deeper within the Kumo by default – and with Senkou Span B climbing higher towards Senkou Span A, there could be a bearish Kumo Twist happening in the next 2-3 weeks or so, which would favor a downside scenario which Stochastic indicator is also leaning in favor towards.
Fundamentally, it seems that USD influence on EUR/USD is actually stronger than positive Euro-Zone news. This is not saying that we should ignore future Euro-Zone economic data (especially since they are potential landmines), but rather traders will do well to not ignore US news and direction of US stock market moving forward.
More Links:
GBP/USD – Steady as British Manufacturing PMI Rises
USD/CAD – US Dollar Remains Strong in Thin Holiday Trading
AUD/USD – Aussie Edges Higher as Chinese Manufacturing Data Meets Expectations
This article is for general information purposes only. It is not investment advice or a solution to buy or sell securities. Opinions are the authors; not necessarily that of OANDA Corporation or any of its affiliates, subsidiaries, officers or directors. Leveraged trading is high risk and not suitable for all. You could lose all of your deposited funds.

Mingze Wu
Latest posts by Mingze Wu (see all)
- European Bourses Not Enjoying Bullish Winds From US Stocks - 17 April 2014
- More Aggressive Stimulus Possible Despite Premier Li’s Denial - 17 April 2014
- China March FDI -1.5% Y/Y vs +2.05% expected. First decline in more than a year. - 16 April 2014