US stocks tanked with S&P 500 falling 2.5%, the worst drop since 2011. Dow Jones Industrial isn’t far behind, trailing at 2.34%, accelerating the declines seen 2 on Wed after Ben Bernanke’s QE Taper/Ending shocker. The aftermath though strong, cannot truly be regarded as shocking as US stocks were already defying gravity by pushing holding gains in recent days despite continued the global equities bearish sentiment that was sparked by Nikkei 225 fall. With the anti-gravity booster that’s continued QE3 being swiped away by Bernanke, it make sense that US stocks are coming down heavily, as the saying goes “the higher you are, the harder you fall”, with all other major indices already heading lower, it is reasonable that the bears of US stocks are playing catching up, and they are catching up fast.
S&P 500 Weekly Chart
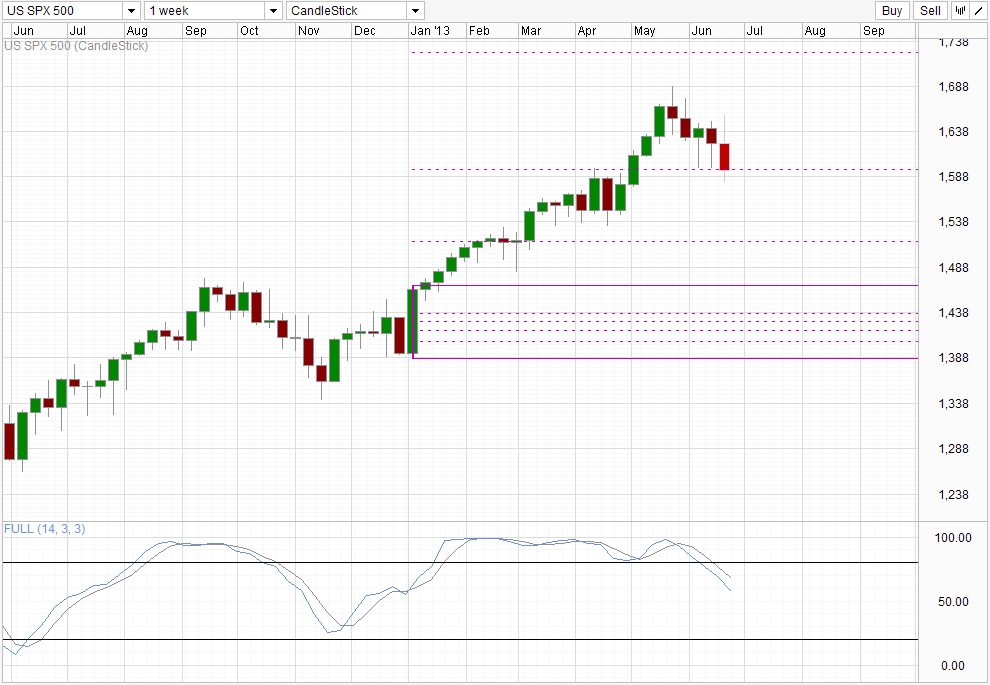
The Channel that was mentioned for the past 2 days has since broken on the downside for both S&P 500 and DJI. Hence we are having potential further bearish extension/acceleration on our hands for both indexes. The question right now is how far price can fall.
Looking weekly chart, we can see that price is heading towards a consolidation range between 1,550 – 1,590 (or 1,530 – 1,600 if we are more generous). The consolidation range is also the confluence with the 161.8% and 261.8% Fib extension of the initial breakout on the 1st week of 2013 which sparked the strong rally seen in 2013. If the Fib reference is reliable, a break of the 261.8% Fib confluence opens up the 161.8% downside target with 1,530 – 1,550 providing interim support. Stochastic readings suggest that we are currently in a strong longer-term correction which lends strength to the possibility of price heading back below 1,530-1,550.
Dow 30 Weekly Chart
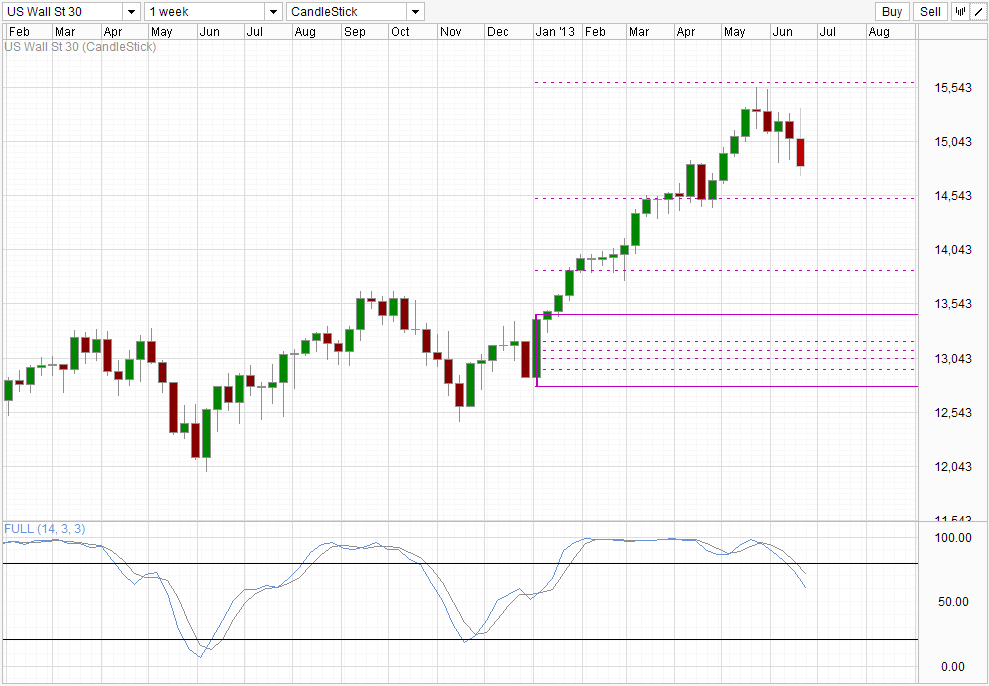
Stochastic on Dow 30 is similar to S&P 500. However, in terms of longer-term trend, Dow 30 is more bullish than S&P, with price still trading above the 261.8% Fib extension. This extension level may provide support against any further slide and we could potentially see slight rebound from there especially since we’re still a fair distance away from it (more than 300 points which is equivalent to 2 consecutive days of triple digit loss). From a pure technical point of view, the likelihood of a technical rebound or “dead cat bounce” is higher after extended move. Hence the possibility of the 261.8% Fib holding becomes higher. That does not eliminate the chance of price breaking 261.8% by early next week though, but if price did manage to achieve that, it will underline an extremely strong bearish sentiment which may mean even stronger bearish movements for S&P 500 and perhaps even other global equity indexes.
More Links:
GBP/USD – Pound Struggling as Fed says QE Tightening Likely
USD/CAD – Higher as Fed Signals QE Reduction
AUD/USD – Aussie Plunge Continues after Fed Says QE Reduction Likely
This article is for general information purposes only. It is not investment advice or a solution to buy or sell securities. Opinions are the authors; not necessarily that of OANDA Corporation or any of its affiliates, subsidiaries, officers or directors. Leveraged trading is high risk and not suitable for all. You could lose all of your deposited funds.

Mingze Wu
Latest posts by Mingze Wu (see all)
- European Bourses Not Enjoying Bullish Winds From US Stocks - 17 April 2014
- More Aggressive Stimulus Possible Despite Premier Li’s Denial - 17 April 2014
- China March FDI -1.5% Y/Y vs +2.05% expected. First decline in more than a year. - 16 April 2014