The multi-year trendline that has been keeping bears at bay is finally broken last Friday, long live the trendline. However that would also mean that bears will be able to usher in a new era of lows from here out. Currently we’re trading below the 0.785 round number cum interim floor back in Jul 2012, and a confirm break will open up 0.745 as the next level of support. Beyond 0.745, we will need to start looking at Monthly Chart for relevant support/resistances (not shown in this article), which 0.735 has proven to be highly significant, acting as the support back between June 2007 – June 2008, and the ceiling from Sept 2009 – Sept 2010, and the floor immediately after from Oct 2010 – Mar 2011.
Weekly Chart
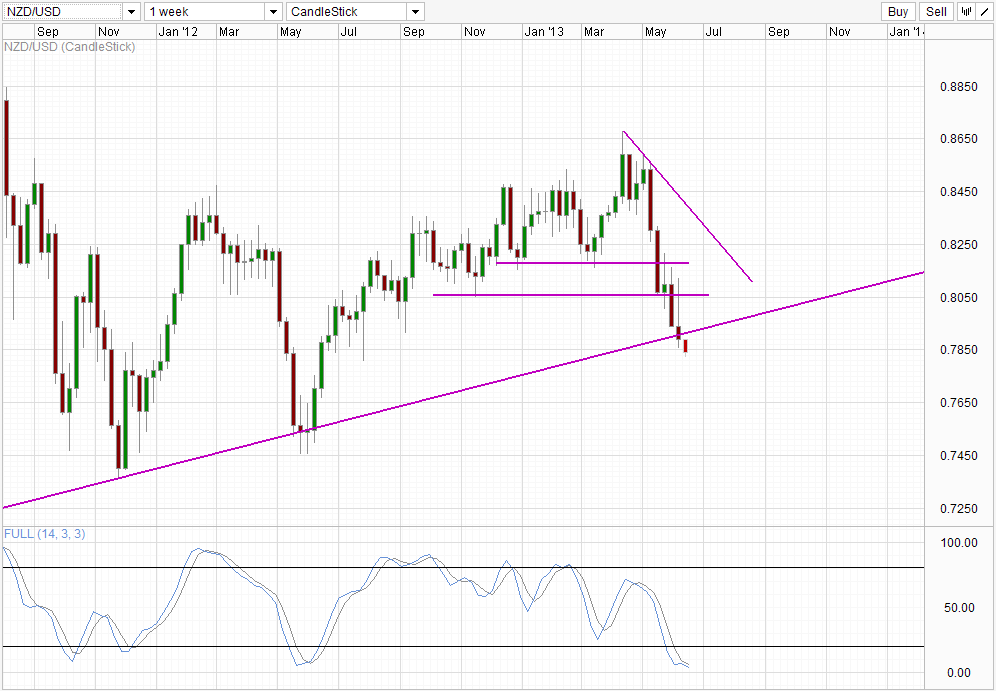
However, there is a possibility of a fakeout happening right now. Even though the breaking of the Multi-Year trendline technically happened last Friday, it is worth noting that such trendlines are never drawn precisely, furthermore this being a multi-year line, any slight shift of 0.1 degree can result in a shift of 10-30 pips at the bare minimum. Hence it will be considered aggressive to consider last Friday’s closing level as a break without seeking any further confirmation. Considering that Stochastic readings are currently extremely Oversold, perhaps some prudence should be exercised.
Hourly Chart
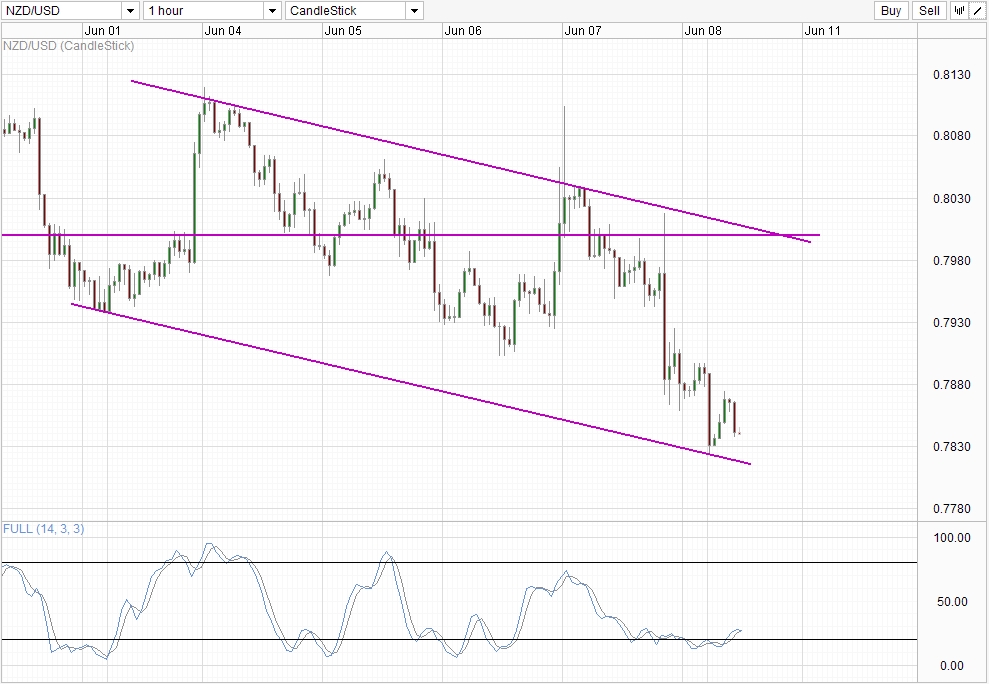
Short-term chart is also bearish, with the descending Channel firmly in play. However, price appears to have bounce off Channel bottom during early Asian session and that may result in a push towards Channel Top. This would enhance the probability of a Fakeout as described in the Weekly Chart above. Conversely, should price manage to break the Channel and usher in an accelerated move lower, this can act as a confirmation for the bearish breakout on the Weekly Chart. Stochastic on the short-term chart favors a move higher though, with readings pushing higher after clearing the 20.0 level. However there could be a case for an interim peak for Stochastic as Stoch line is looking likely to cross Signal line right now, with historical readings showing that current Stoch levels have a tendency to form peaks in the past.
Fundamentally, NZD/USD is weak due less to a weakening economy but rather due to the extremely dovishness of RBNZ, which has been made clear by RBNZ Governor Wheeler. However, even so, it is unlikely that RBNZ’s intervening of NZD via selling it directly in the secondary markets have any long-lasting effect such as this. A large part of current decline can actually be attributed to the bearish sentiments surrounding AUD/USD which has climbed around 1,200 pips from its 2013 high. With that in mind, will NZD/USD rebound higher when such sentiment evaporate – ala USD/JPY right now? The possibility is there, hence the confirmation for current breakout become all the more imperative.
More Links:
AUD/USD – Moves to 20 Month Low Below 0.94
EUR/USD – Easing Back to the Key Level of 1.32
Week in FX Asia – Is the Yen’s Apocalyptic Move Over?
This article is for general information purposes only. It is not investment advice or a solution to buy or sell securities. Opinions are the authors; not necessarily that of OANDA Corporation or any of its affiliates, subsidiaries, officers or directors. Leveraged trading is high risk and not suitable for all. You could lose all of your deposited funds.

Mingze Wu
Latest posts by Mingze Wu (see all)
- European Bourses Not Enjoying Bullish Winds From US Stocks - 17 April 2014
- More Aggressive Stimulus Possible Despite Premier Li’s Denial - 17 April 2014
- China March FDI -1.5% Y/Y vs +2.05% expected. First decline in more than a year. - 16 April 2014