Weekly Chart
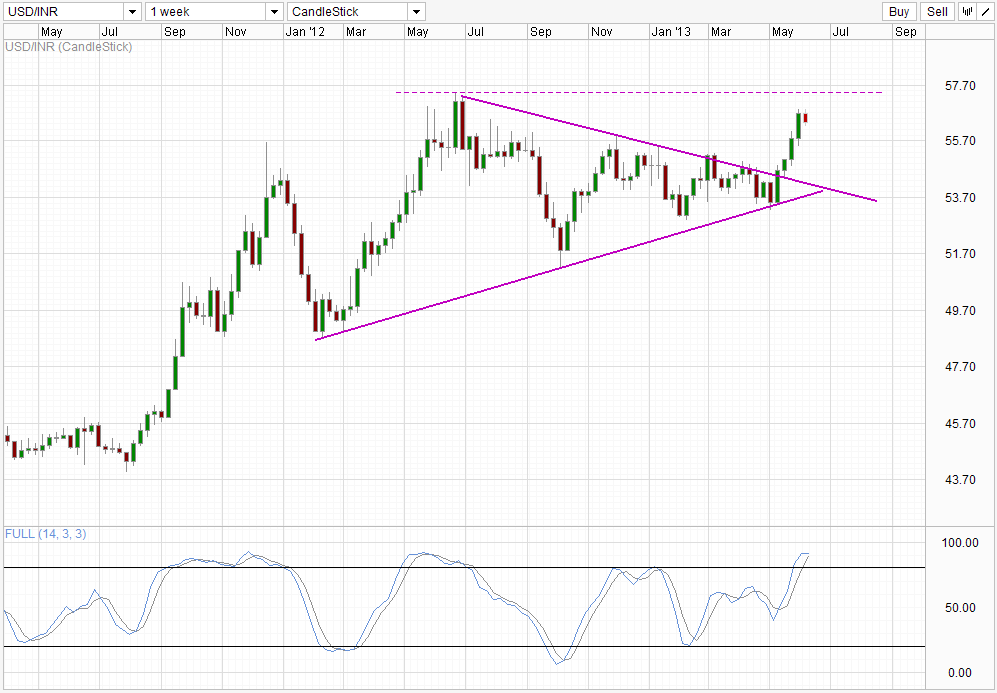
After breaking higher from the Triangle at the start of May, price has been riding steadily higher without any sign of pullback. However, bullish momentum is showing signs of slowing down even before the previous 2012 high is reached. Stochastic readings are currently flattening off, with reading closing in on the Signal line, with a cross looking likely within the next 1-2 weeks. If the indicator proves to be correct, we could be seeing price losing its gains in May to trade towards the descending trendline. 55.70 will be an important support level to be broken, with trading range 53.7 – 55.7 opening up should it happen.
From a fundamental perspective, the increase in INR strength can be attributed to the Central Bank RBI’s new policy which stops Gold importers from buying on credit. RBI believes the current-account deficit is caused by huge speculation on Gold and Oil imports. By stifling speculation, RBI is one step closer to restore confidence in its fiscal soundness, which has taken a huge beating in 2013, resulting in the strong USD/INR move. To worsen the issue, USD has been gaining strength against all majors, which allowed USD/INR to climb even higher in May.
The question now is whether fundamentals will support a fall of USD/INR in line with what technicals suggest. It is hard to see the anti-speculative measures instilled by RBI late last month having any long-term bullish impact on the INR. Economy of India continue to look weak, with high inflation and a shrinking treasury that prevents RBI from engaging in any strong stimulus measure. GDP growth in 2013 is expected to fall to around 5%, the lowest in 10 years, which does not bode well for the strength of INR moving forward.
With that in mind, it is hard to imagine USD/INR bears having good strong follow-through lower. Perhaps a correction is possible, but it will take tremendous shift in fundamentals to bring USD/INR back to sub 50.0 levels. Furthermore, with US stocks performing well, and bond yields rising, traders who are interested in carry may not find such price attractive to hold rupees with higher alphas to be earned elsewhere. Recent rate cuts (to the tune of 0.75% YTD) are also not helping, making the risky carry even less attractive. However, things may change when USD/INR reaches above 57.7, and the cheap INR and the resistance from 2012 high may be a good enough incentive for a resurgence in INR carry.
More Links:
USD/JPY Technicals – Bulls above 100.0 vs Bears below 100.5
AUD/USD – 0.96 Holding Despite weaker than expected GDP
EUR/USD – Settles Below Resistance at 1.31
This article is for general information purposes only. It is not investment advice or a solution to buy or sell securities. Opinions are the authors; not necessarily that of OANDA Corporation or any of its affiliates, subsidiaries, officers or directors. Leveraged trading is high risk and not suitable for all. You could lose all of your deposited funds.

Mingze Wu
Latest posts by Mingze Wu (see all)
- European Bourses Not Enjoying Bullish Winds From US Stocks - 17 April 2014
- More Aggressive Stimulus Possible Despite Premier Li’s Denial - 17 April 2014
- China March FDI -1.5% Y/Y vs +2.05% expected. First decline in more than a year. - 16 April 2014